This page describes how to use Akita features that provide cluster-wide monitoring of your deployment, staging, or test environment.
We're still actively building our capabilities for continuous and cluster-wide monitoring, and we welcome feature requests or bug reports! Please let us know what you'd like to see.
Collecting traces continuously
Use the akita apidump command to collect data continuously and have Akita create API models for you. The command will automatically create a trace that signals Akita to automatically create models and timelines for your project.
akita apidump --project your-project
The trace will continue until the command is stopped by a SIGTERM or SIGINT. To run for a limited time and then stop, you can execute a command inside the apidump command, like this example which collects an hour-long trace and then exits:
akita project --service your-project -c "sleep 3600" -u root
If you are using Django on Heroku or Express.js middleware, we plan to support running continuously, or on a regular schedule, via the Akita daemon mode. Please let us know if you would like to work with us on this!
Currently, the daemon mode only starts collecting data when temporarily enabled by the user through the Akita console.
Automatically created API model and timeline
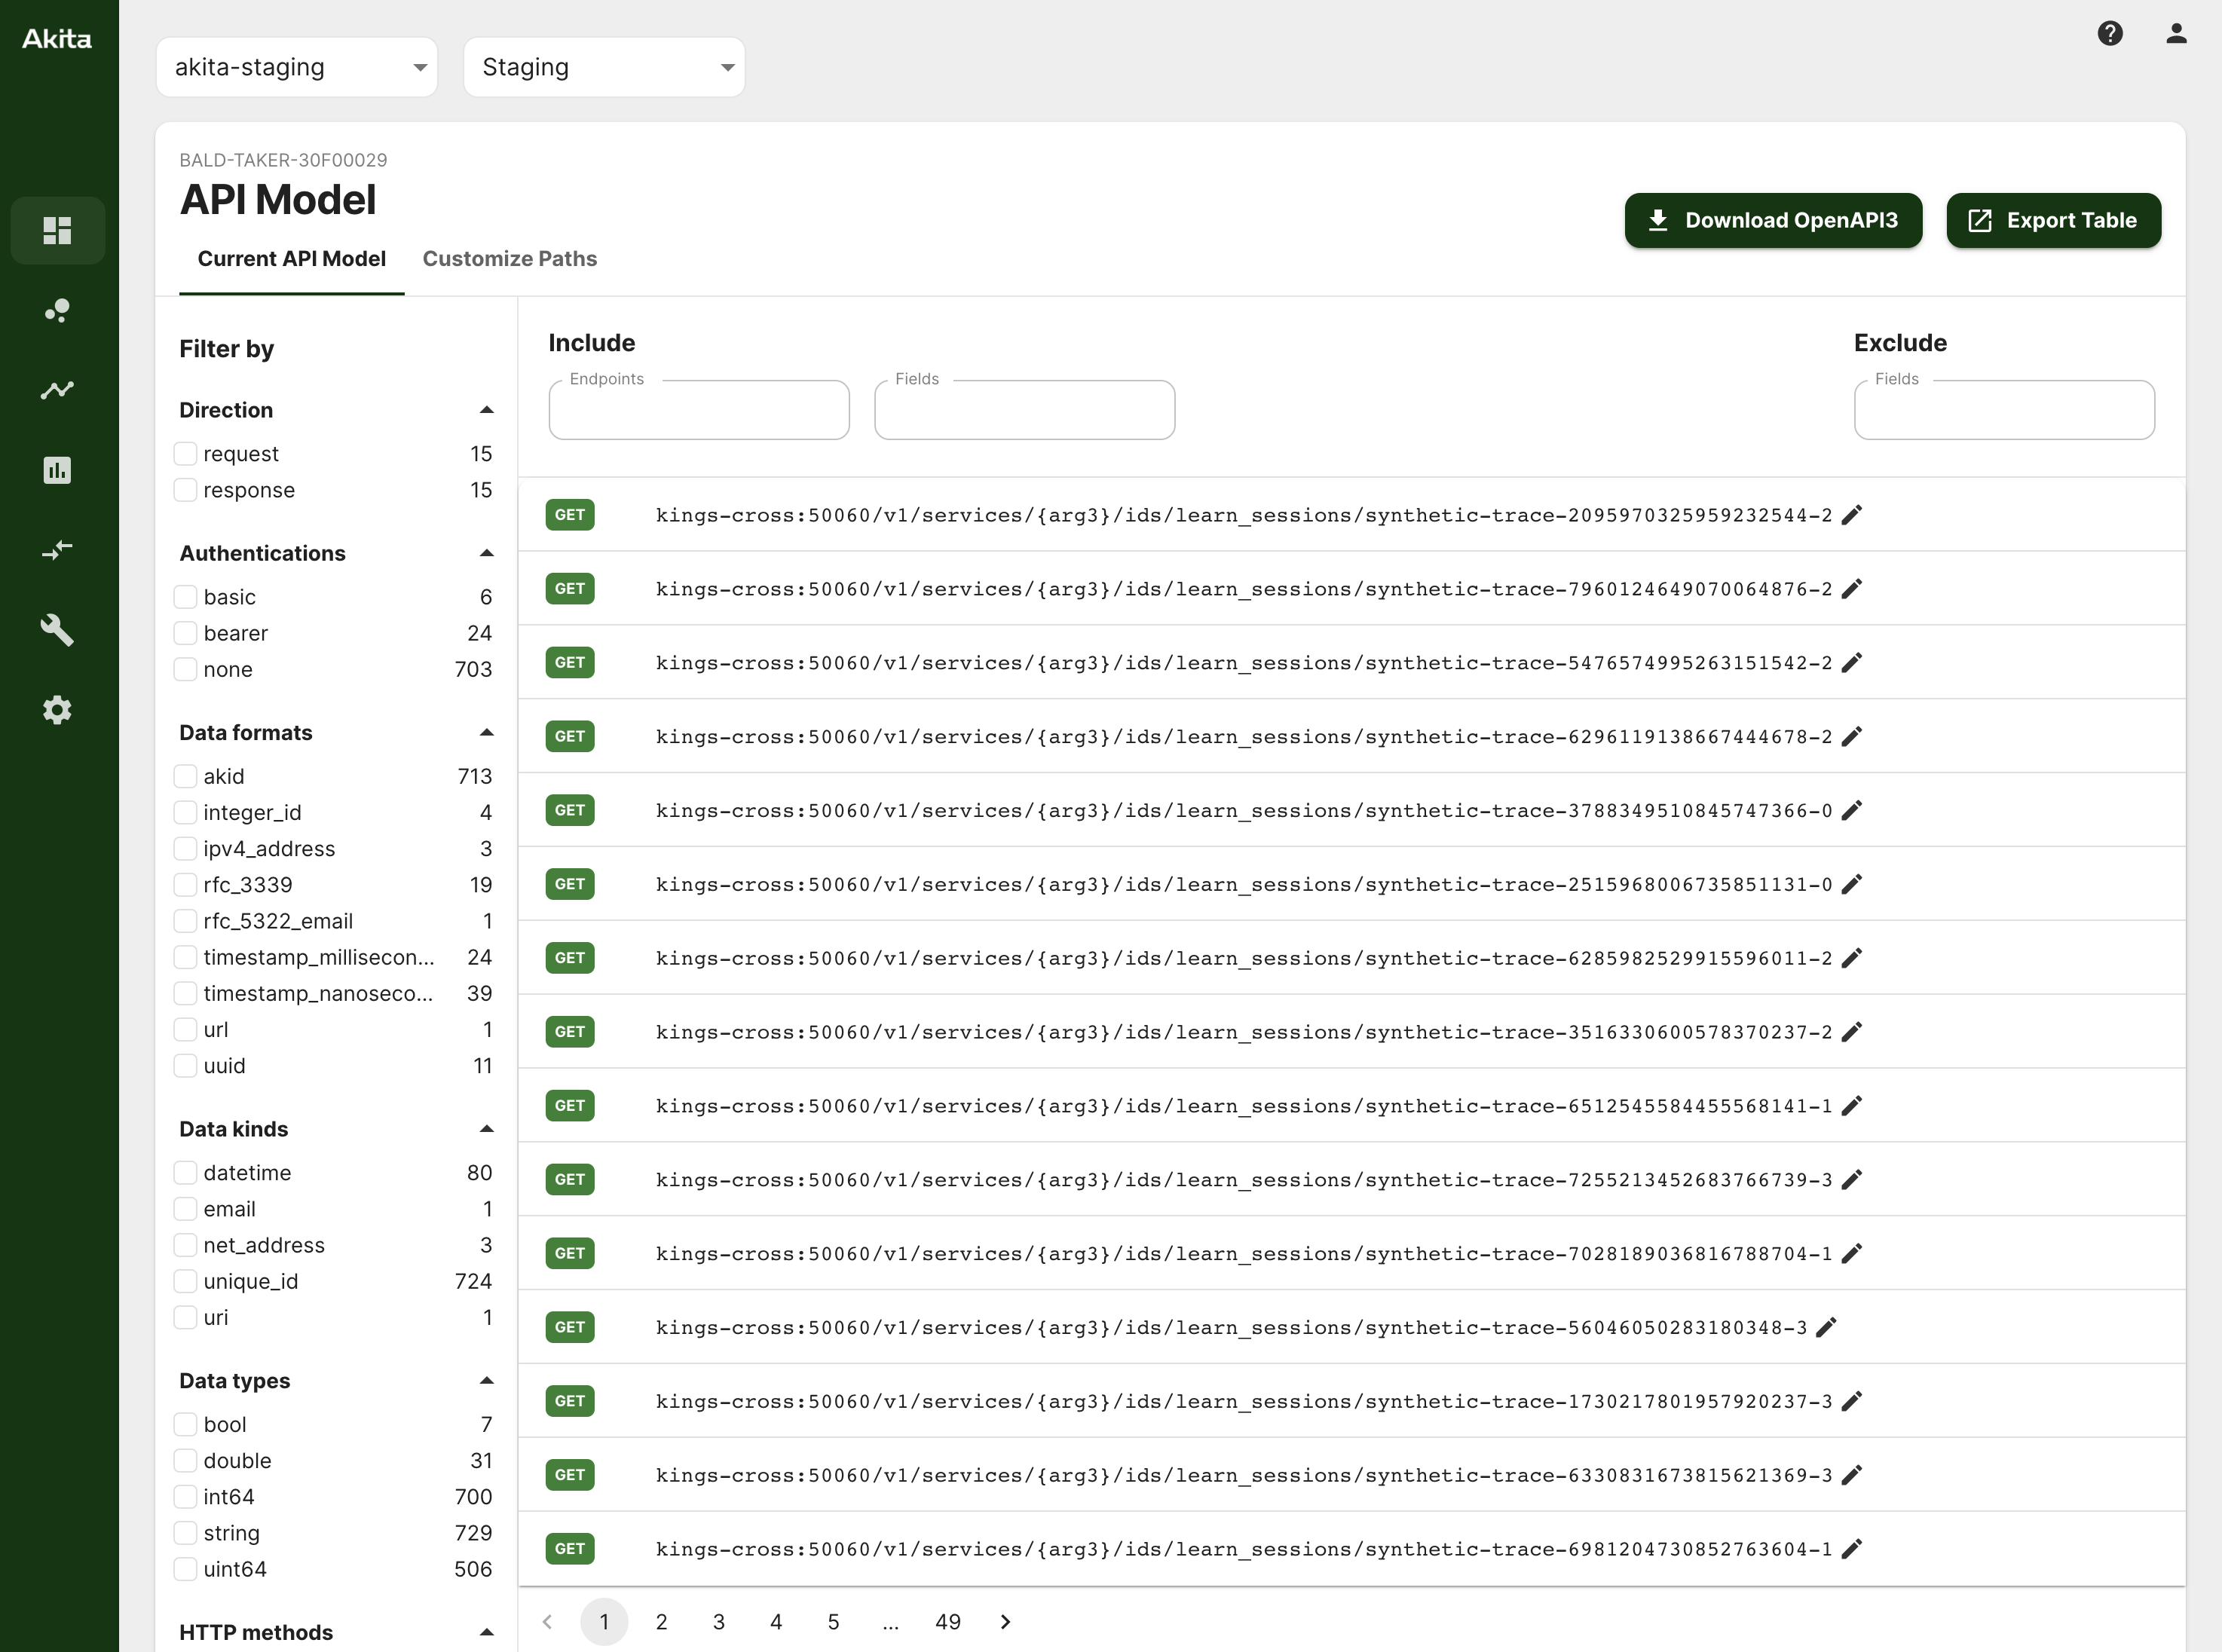
Akita automatically generates models from the traffic that it receives. The "API Model" page shows a model of the traffic from the past week, updated every 10 minutes:

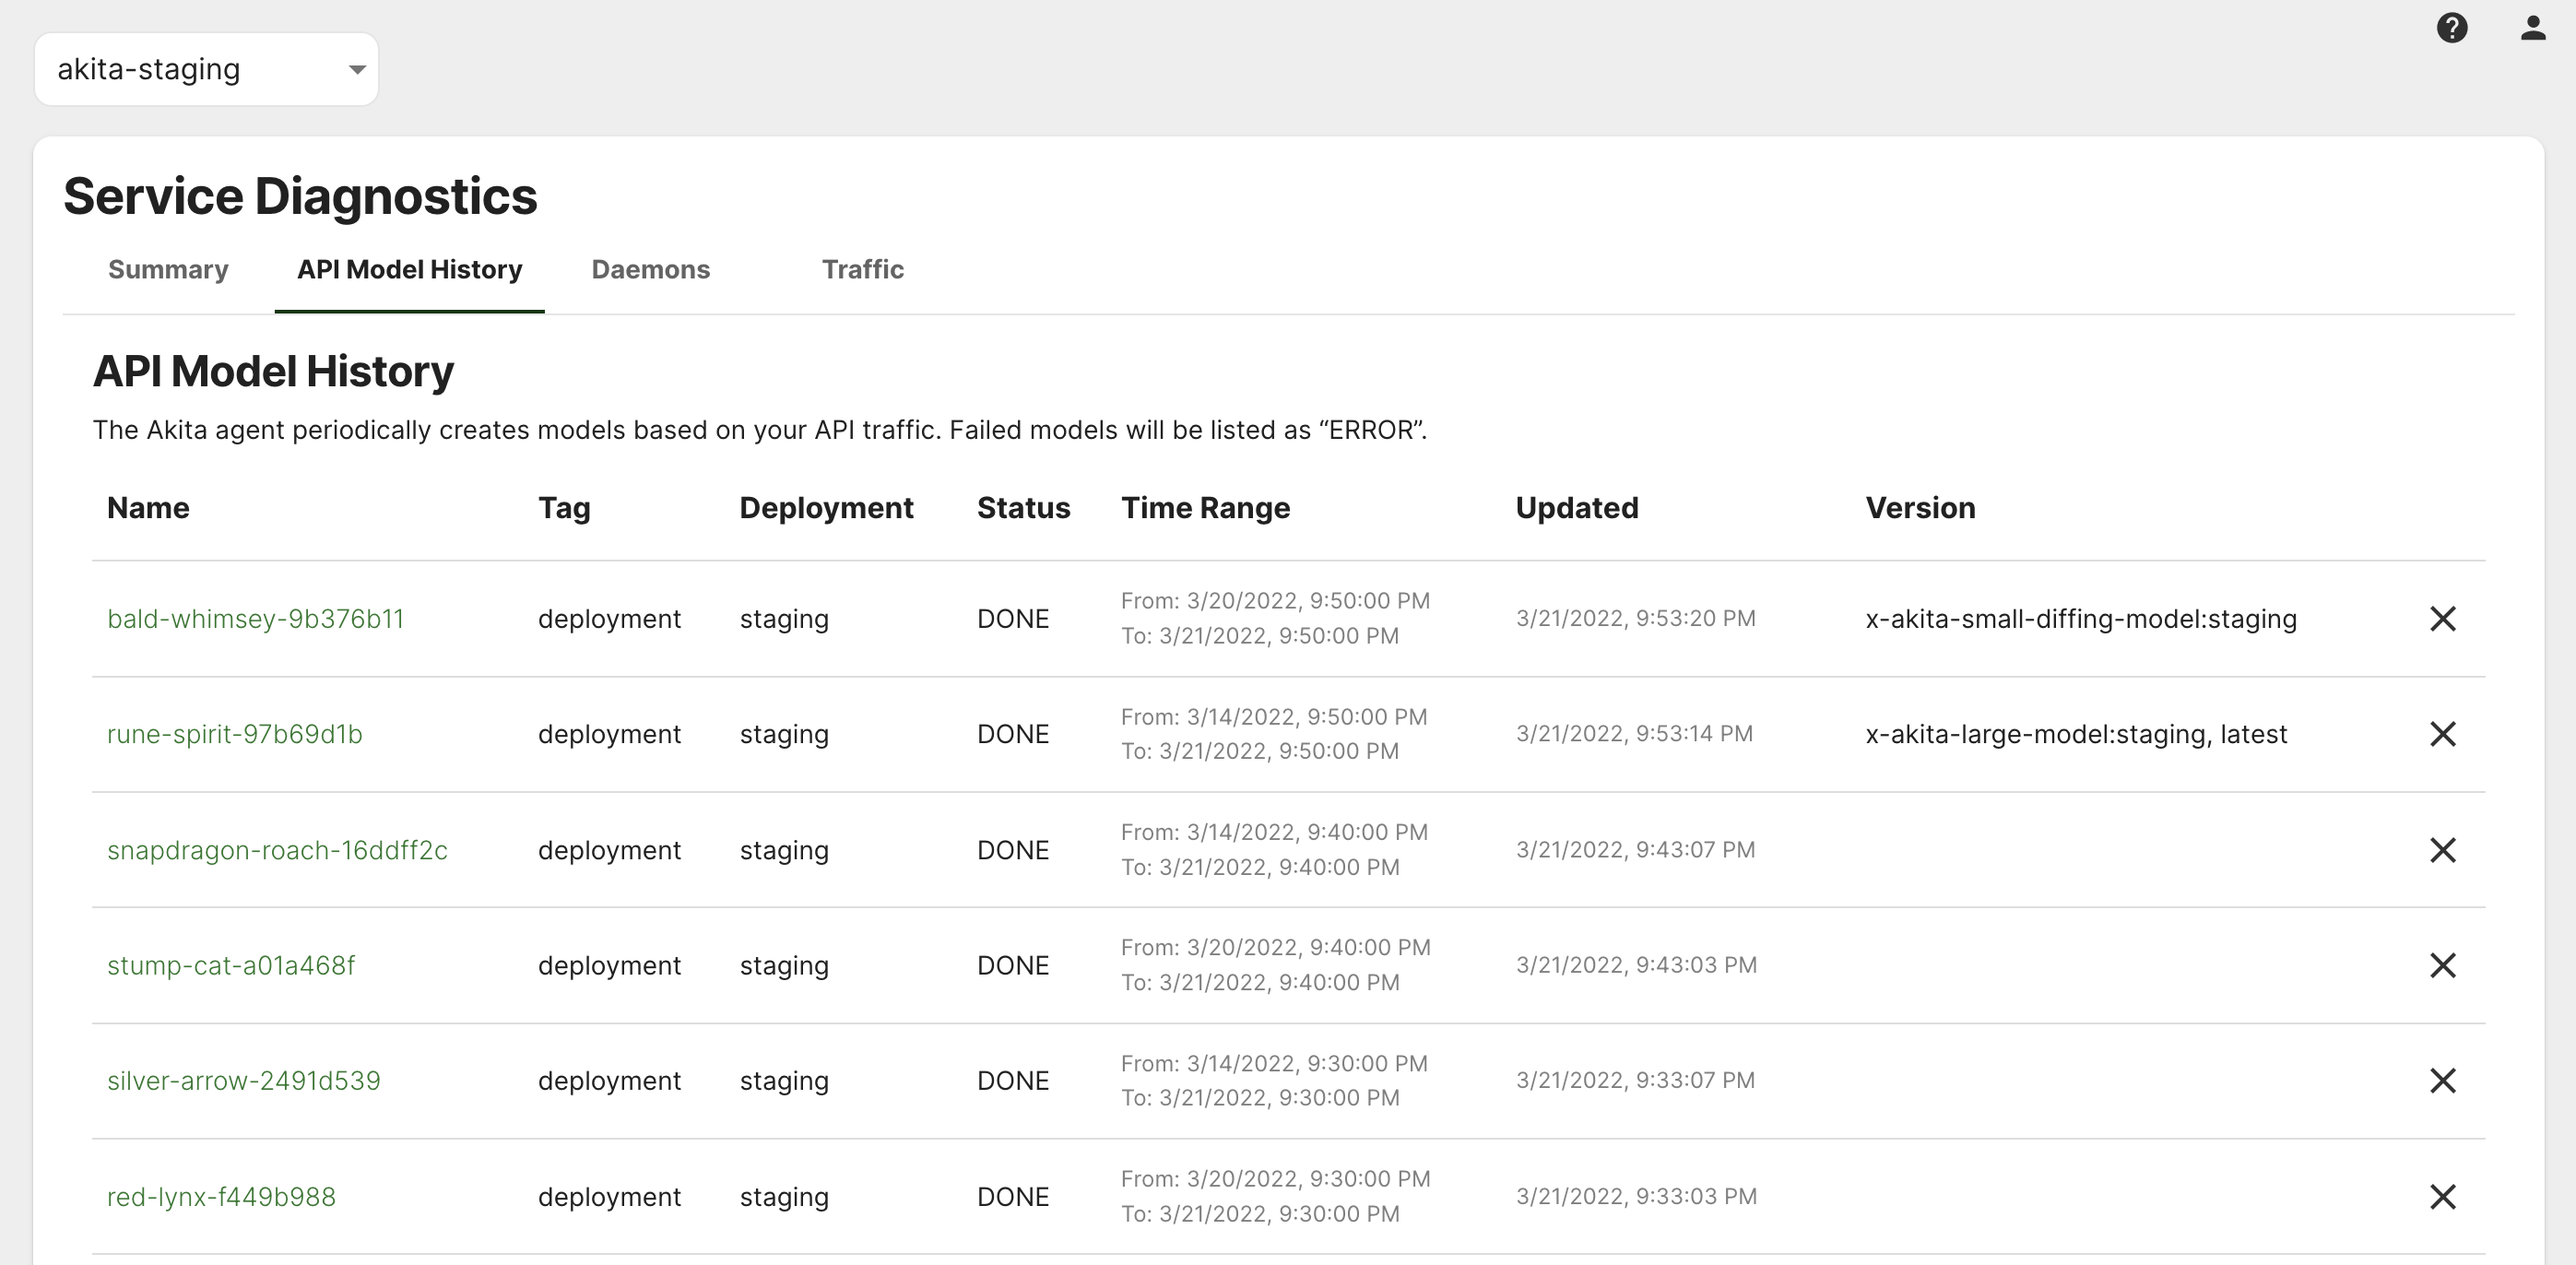
You can view a history of all of these models in the "API model history" tab of the Service Diagnostics view:

You can use these models to see which services and endpoints are active in your cluster, and view the inferred data types associated with each endpoint.