Django on Heroku
Alpha
This is a new feature and we haven't ironed out all the kinks yet! Proceed with appropriate caution.
You can capture API behavior from a Django application running in Heroku using Akita-provided middleware and the Akita Agent running in "daemon" mode.
In this guide, we'll explain:
- How the Daemon Works
- How to add the Akita Django middleware to your application
- How to start and stop staging and production API traffic collection
When to use the Django Middleware
This guide is applicable for capturing API traces from Heroku production and staging environments, or applications run locally using
heroku local.The Django middleware can also be used in non-Heroku environments, if you have a location where the Akita Agent can be run in daemon mode.
How the Daemon works
The akita-django package provides Django middleware that sends each request and response to the Akita Agent, which is operating in "daemon" mode as a long-running process. The Agent obfuscates any identifying information from this trace and sends it, via HTTPS, to Akita Cloud, where an API model can be built from it.
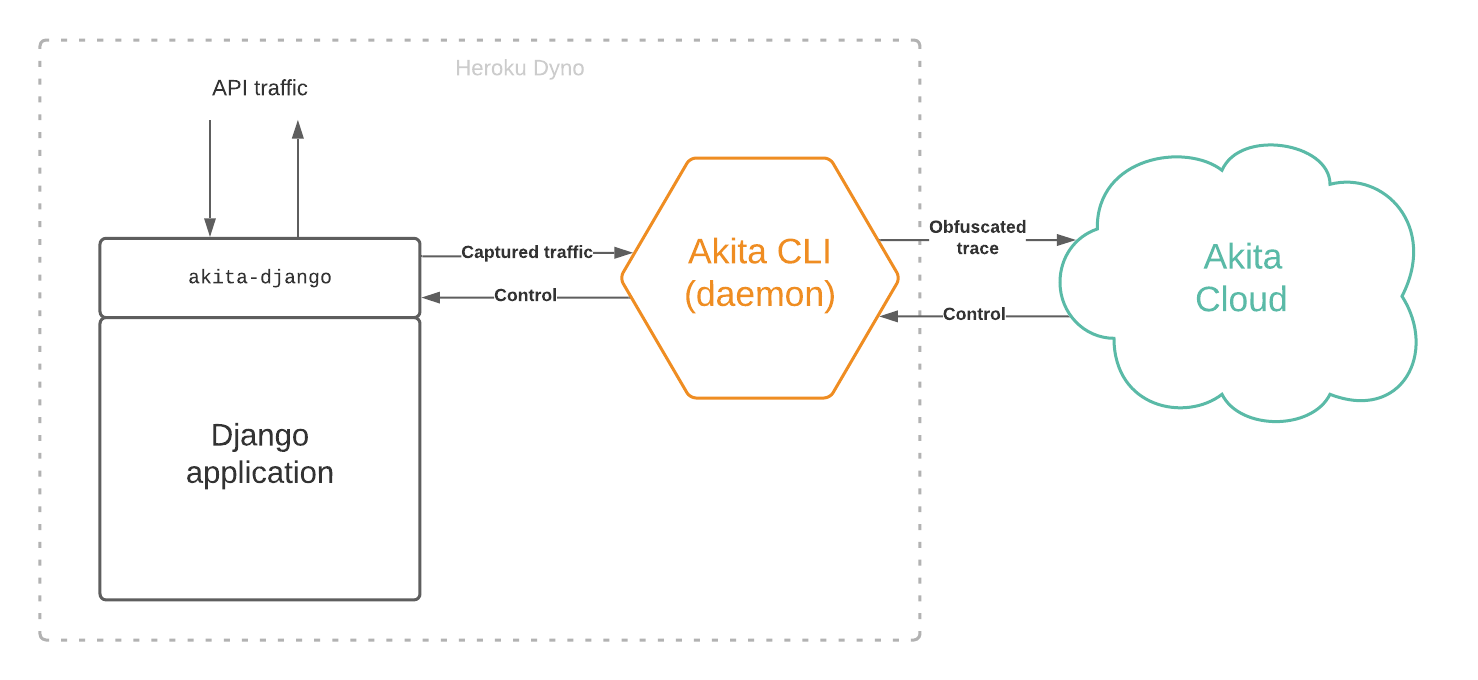
The Akita Cloud controls when the daemon and middleware are actively capturing API traffic; you will start a trace from the Akita web console. In a Heroku environment, the daemon will be run as a separate process in same Heroku dyno.
How to create a project in the Akita web console
Log in to the Akita web console with your username and password. Click the "New Project" button and give your project a descriptive name.
If you have not created an API key, do so now; this can be done through the "Settings" tab in the UI. The API keys are not tied to particular projects.

Add the Akita Django middleware to your application
Add the middleware to dependencies
Add akita-django to your requirements.txt file to mark it as a dependency that Heroku should build and install. The Python package includes the Django middleware, as well as a wrapper around Django.test.Client for use in tests.
Configure Django to to use the middleware
Add akita_django.middleware.AkitaMiddleware to the MIDDLEWARE list in your Django configuration. It should go early in the stack to see the unmodified version of requests, and the fully-processed version of responses.
Then, add the project name you created as a new configuration option called AKITA_SERVICE_NAME. You should also set AKITA_MIDDLEWARE_NAME to a descriptive name for the middleware to use in communications; the default is the hostname on which the middleware is running.
MIDDLEWARE = [
    'akita_django.middleware.AkitaMiddleware',
    ...
]

AKITA_SERVICE_NAME = "django-demo"
AKITA_MIDDLEWARE_NAME = "django-heroku-staging"
You may optionally set AKITA_DAEMON_HOST to specify an alternate location for the middleware to send its traffic, but this is not necessary in Heroku. You make also specify AKITA_MAX_QUEUE_LEN to control the amount of buffering used to hold request not yet sent to the daemon.
Enable the daemon in Heroku
The Akita Agent is packaged as a Heroku buildpack that starts the CLI in daemon mode in the background.
First, configure the Heroku environment with the API key that you created earlier. You may also give the daemon an informative name so that you can recognize it on the Akita web console. (By default the name is heroku, with the Dyno name is appended.)
$ heroku config:set AKITA_API_KEY_ID=<your key ID>
$ heroku config:set AKITA_API_KEY_SECRET=<your secret>
$ heroku config:set AKITA_DAEMON_NAME=<daemon name>
Then, add the Akita buildpack:
$ heroku buildpack:add --index 1 https://github.com/akitasoftware/heroku-buildpack-akita.git
The daemon listens on port 50080 by default. You can choose a different port with the AKITA_DAEMON_PORT configuration setting. But, this port is not visible outside of the Heroku dyno.
The Akita CLI buildpack will only work on Ubuntu-based Heroku runtimes; if you use a container runtime, then you must install the Akita Agent inside that container, and start it yourself.
Run your modified app in Heroku
You can try out the modified app locally with heroku local, or deploy it by pushing your changes to Heroku.
If running locally, you must start the Akita Agent in daemon mode. Ensure the AKITA_API_KEY_ID and AKITA_API_KEY_SECRET environment variables are set, and run
$ akita daemon --name <daemon name>
One the daemon is running, you can open your project in the web console, select the "Diagnostics" page and then the "Daemons" tab, and see an indication that the daemon is successfully talking to the Akita Cloud.
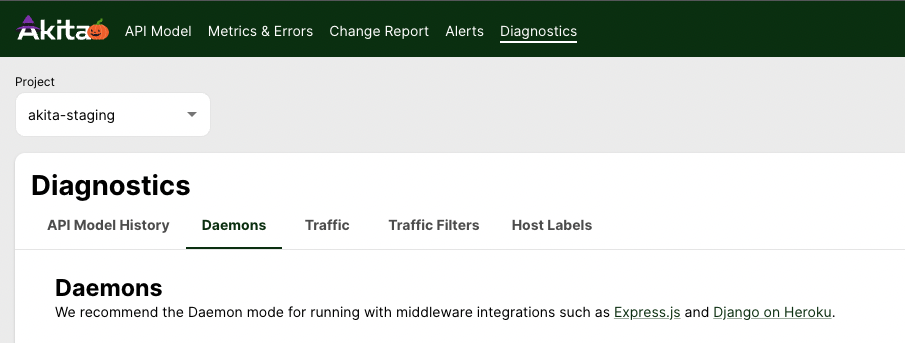
Daemon processes that have sent a heartbeat within the past minute are listed as "healthy"; those who have not communicated are shown as "unhealthy", or removed from the list entirely after 1 hour. Verify that the daemon name you chose is present.
Because the daemon and the middleware are started simultaneously, you will usually move directly to UI shown the next step.
Control trace collection via the Akita Web Console
Once the daemon receives a message from the middleware, indicating that it is ready to collect a trace, the Akita web console page will change. As shown below, it lists the active traces (currently none) and any daemons that are both active, and have communicated with middleware configured with a matching serviceName.
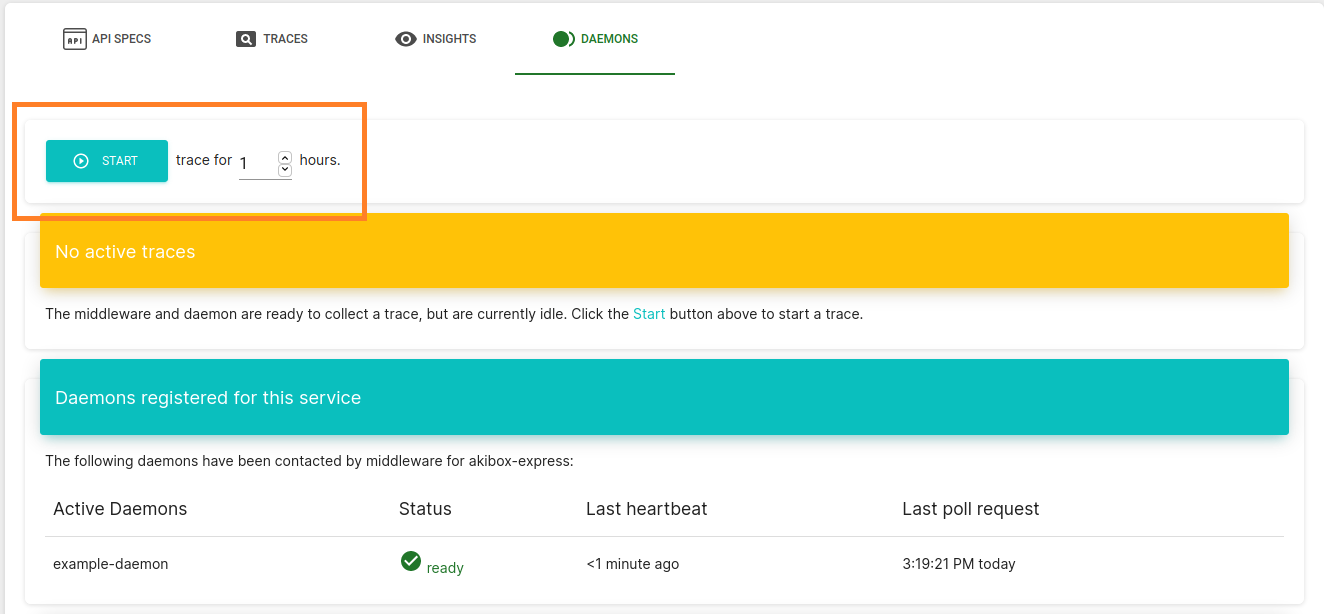
Click the "Start" button to begin a trace. You can select the duration of the trace (as a whole number of hours), but we suggest you start with just one hour on your first attempt. A trace name will be automatically generated. One the trace has started, the UI page will show its start and end time:
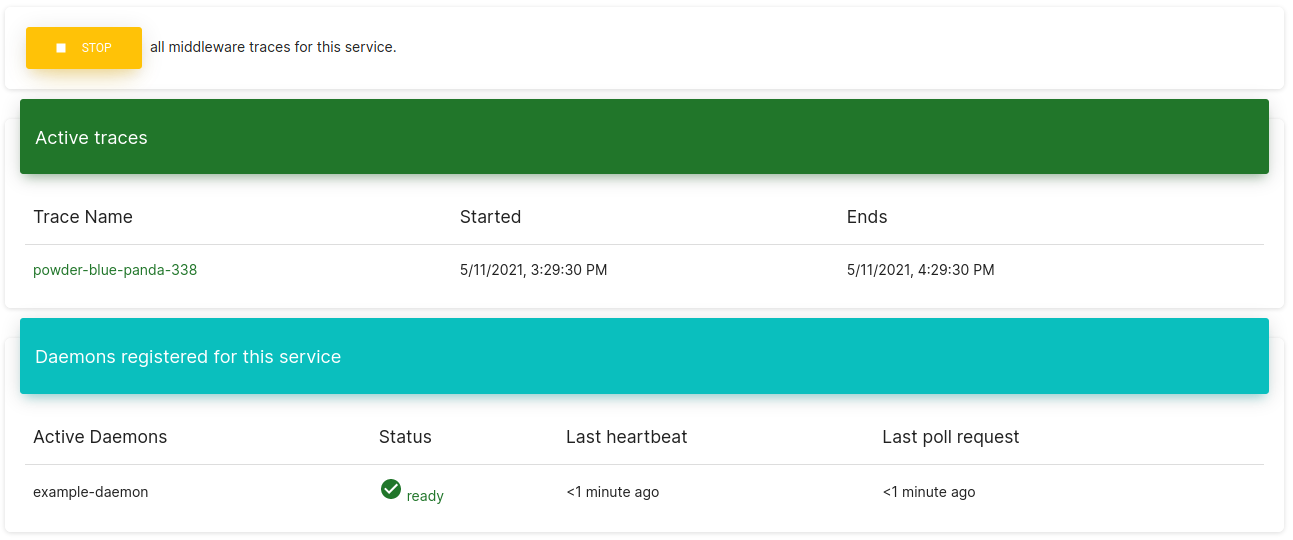
It may take up to a minute for the trace to start, and the page to refresh with the active trace name.
Both the daemon and middleware will issue "info" messages that they have begun collecting the trace:
$ heroku logs
akita: [INFO] Activating trace powder-blue-panda-338 (lrn_6EjLU2sINbfKRwmqeqQM8s)
akita_middleware: Activating trace powder-blue-panda-338 (lrn_6EjLU2sINbfKRwmqeqQM8s)
You may stop the trace at any time by pressing the "Stop" button. This operation may also take up to a minute to complete.
See your API model!
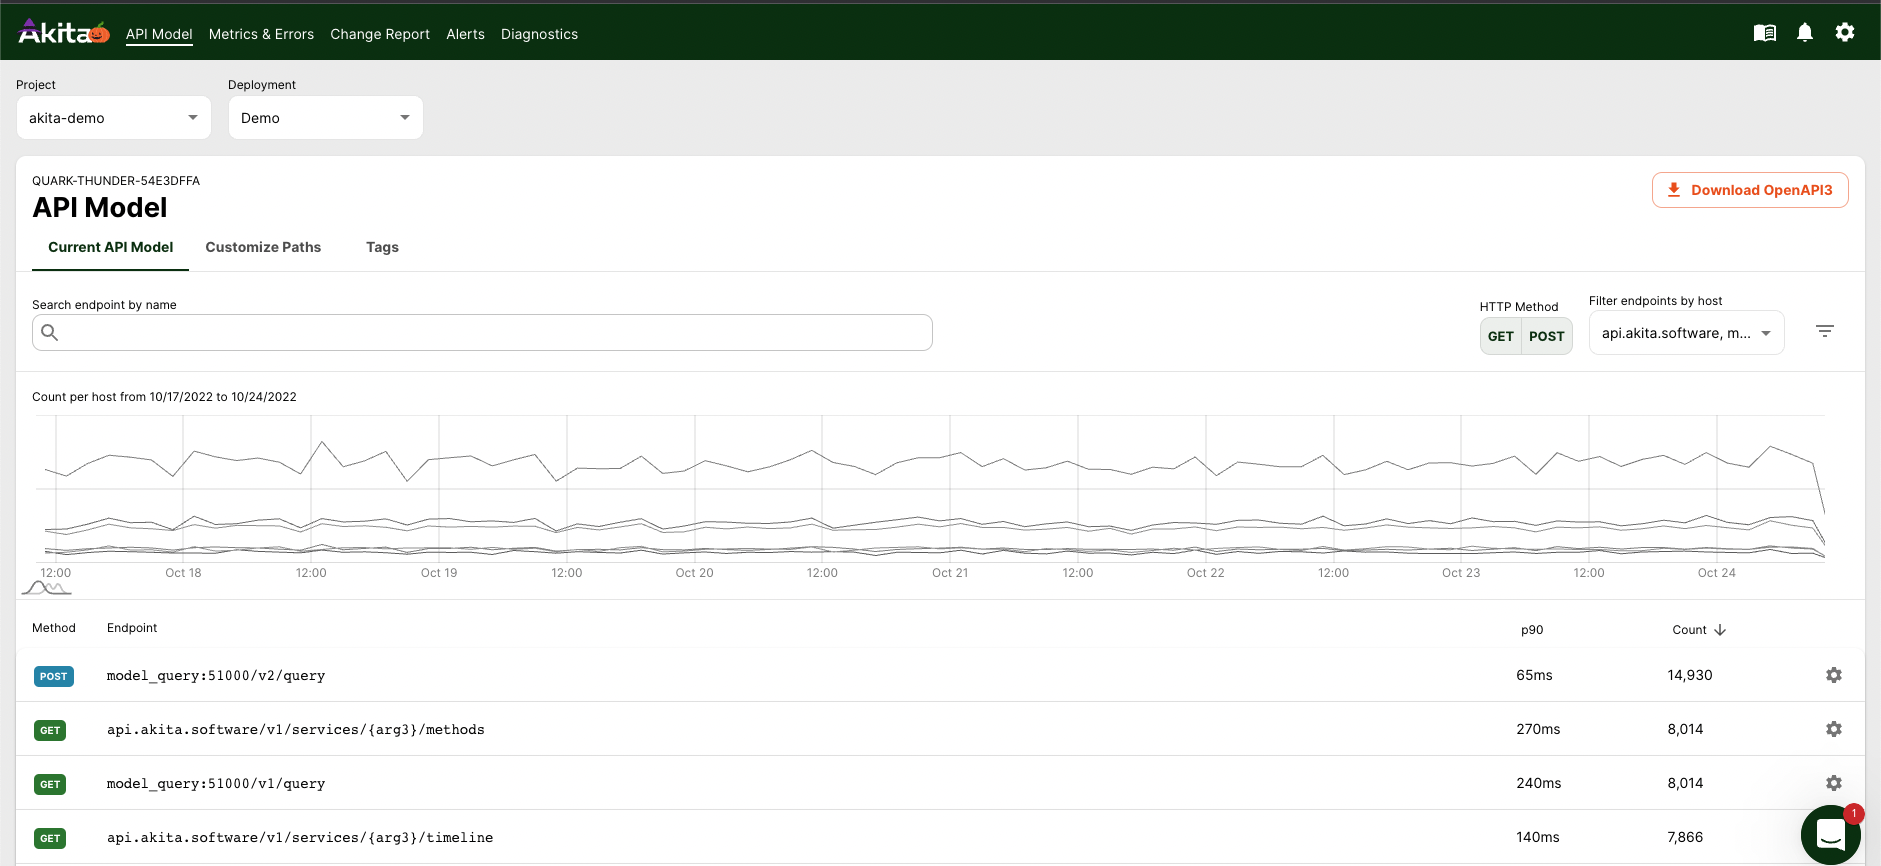
Once the trace starts, Akita will automatically create models from it. There will be about a three-minute delay before the first model is ready in the "API model" tab.
The API spec will show each endpoint that was present in the trace. On this page you can filter by criteria such as authentication type, method, or response code. Within each endpoint you can see the request and response types, and timing measurements obtained from the trace.
Updated almost 3 years ago