
Monitors and Alerts
Akita makes it easy to track the health and performance of your endpoints with API monitors. An API monitor can measure one of several different health and performance metrics, and notify you when that value passes a given threshold.
We'll email alert notifications to you by default, but you can also receive notifications in a Slack channel by setting up our Slack App.
Suggested monitors
After you've been set up with Akita for a little while, we'll start suggesting monitors that we think you'd find useful. These will appear at the top of the Monitors page in the Akita console. For each proposed monitor, you'll see a description of the metric and threshold, and an explanation of why we think you'd find it useful. You'll have the option to "Accept" or "Dismiss" each monitor.
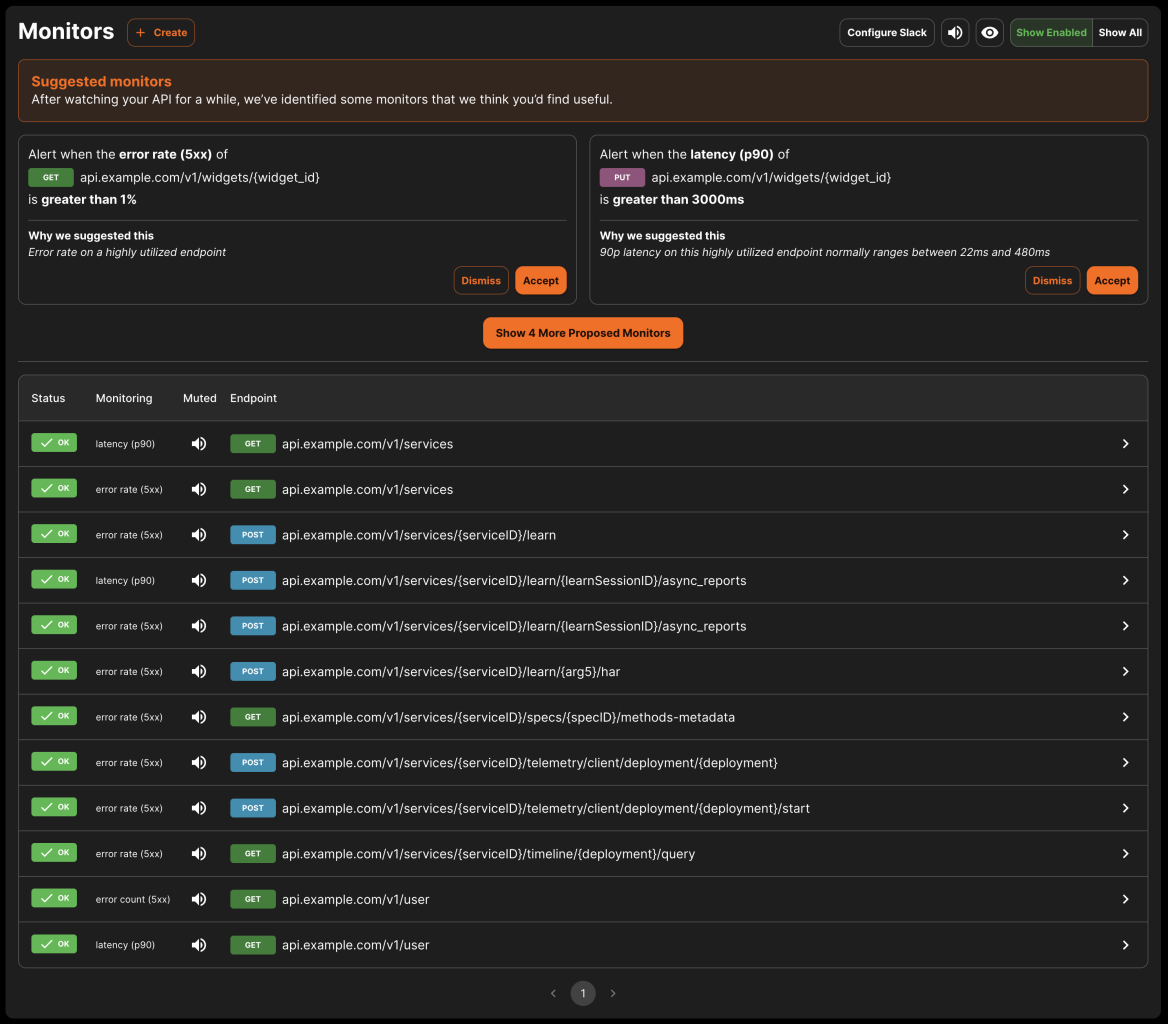
The Monitors page, with a few proposed monitors shown at the top.
If you choose to dismiss a proposed monitor, it will be hidden from view and will not trigger alerts. If you change your mind, you can still find it by clicking "Show All" at the top of the Monitors page and re-enable it by clicking the button in the "Hidden" column to unhide it.
Creating a monitor
While we'll propose monitors that we think you'll find useful, you can always create your own by clicking the "Create" button in the upper left-hand corner of the Monitors page. This will open the New Monitor dialog.
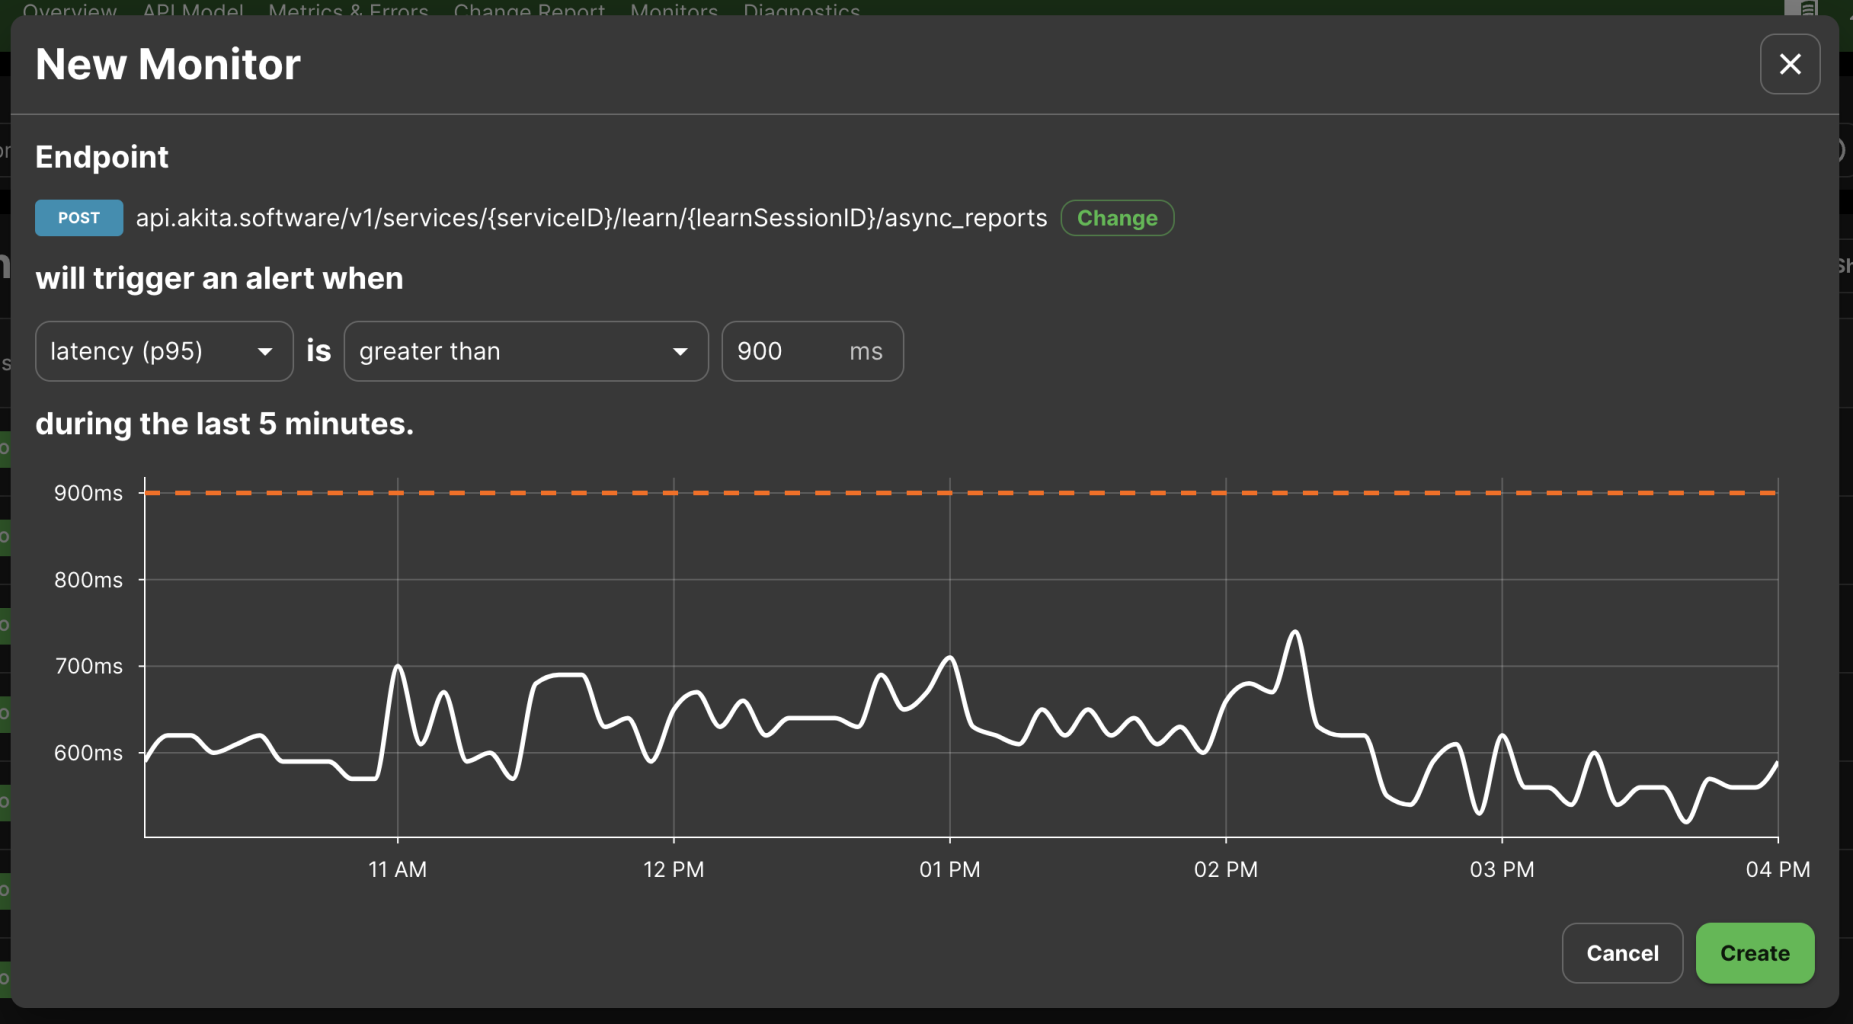
Creating a monitor using the New Monitor dialog.
First, find the endpoint you wish to monitor using the search box. Once you've picked an endpoint, you'll be able to define your monitor using the following three values:
- A metric to monitor.
- A comparator to define when we should alert you about your threshold value being crossed (e.g. "greater than" or "less than").
- A threshold value.
Putting it all together, the selected endpoint will trigger an alert whenever the metric has crossed beyond your threshold, as evaluated by your selected comparator. For example, in the image above, we'll get an alert whenever that endpoint experiences a 95th percentile response latency of more than 900ms over the preceding 5 minutes.
Metrics
You can select from the following list of metrics:
- Latency (median)
- The median response latency for the endpoint, in milliseconds.
- Latency (p90)
- The 90th percentile response latency for the endpoint, in milliseconds.
- Latency (p95)
- The 95th percentile response latency for the endpoint, in milliseconds.
- Latency (p99)
- The 99th percentile response latency for the endpoint, in milliseconds.
- Error rate (4XX)
- The percentage of responses (out of all responses from the endpoint) that have 4XX response codes.
- Error rate (5XX)
- The percentage of responses (out of all responses from the endpoint) that have 5XX response codes.
Viewing a monitor
You can view a monitor by clicking on its entry in the table on the Monitors page. You'll see the endpoint to which the monitor belongs, an explanation of the current status of the monitor, and a timeline visualizing the history of the monitor.
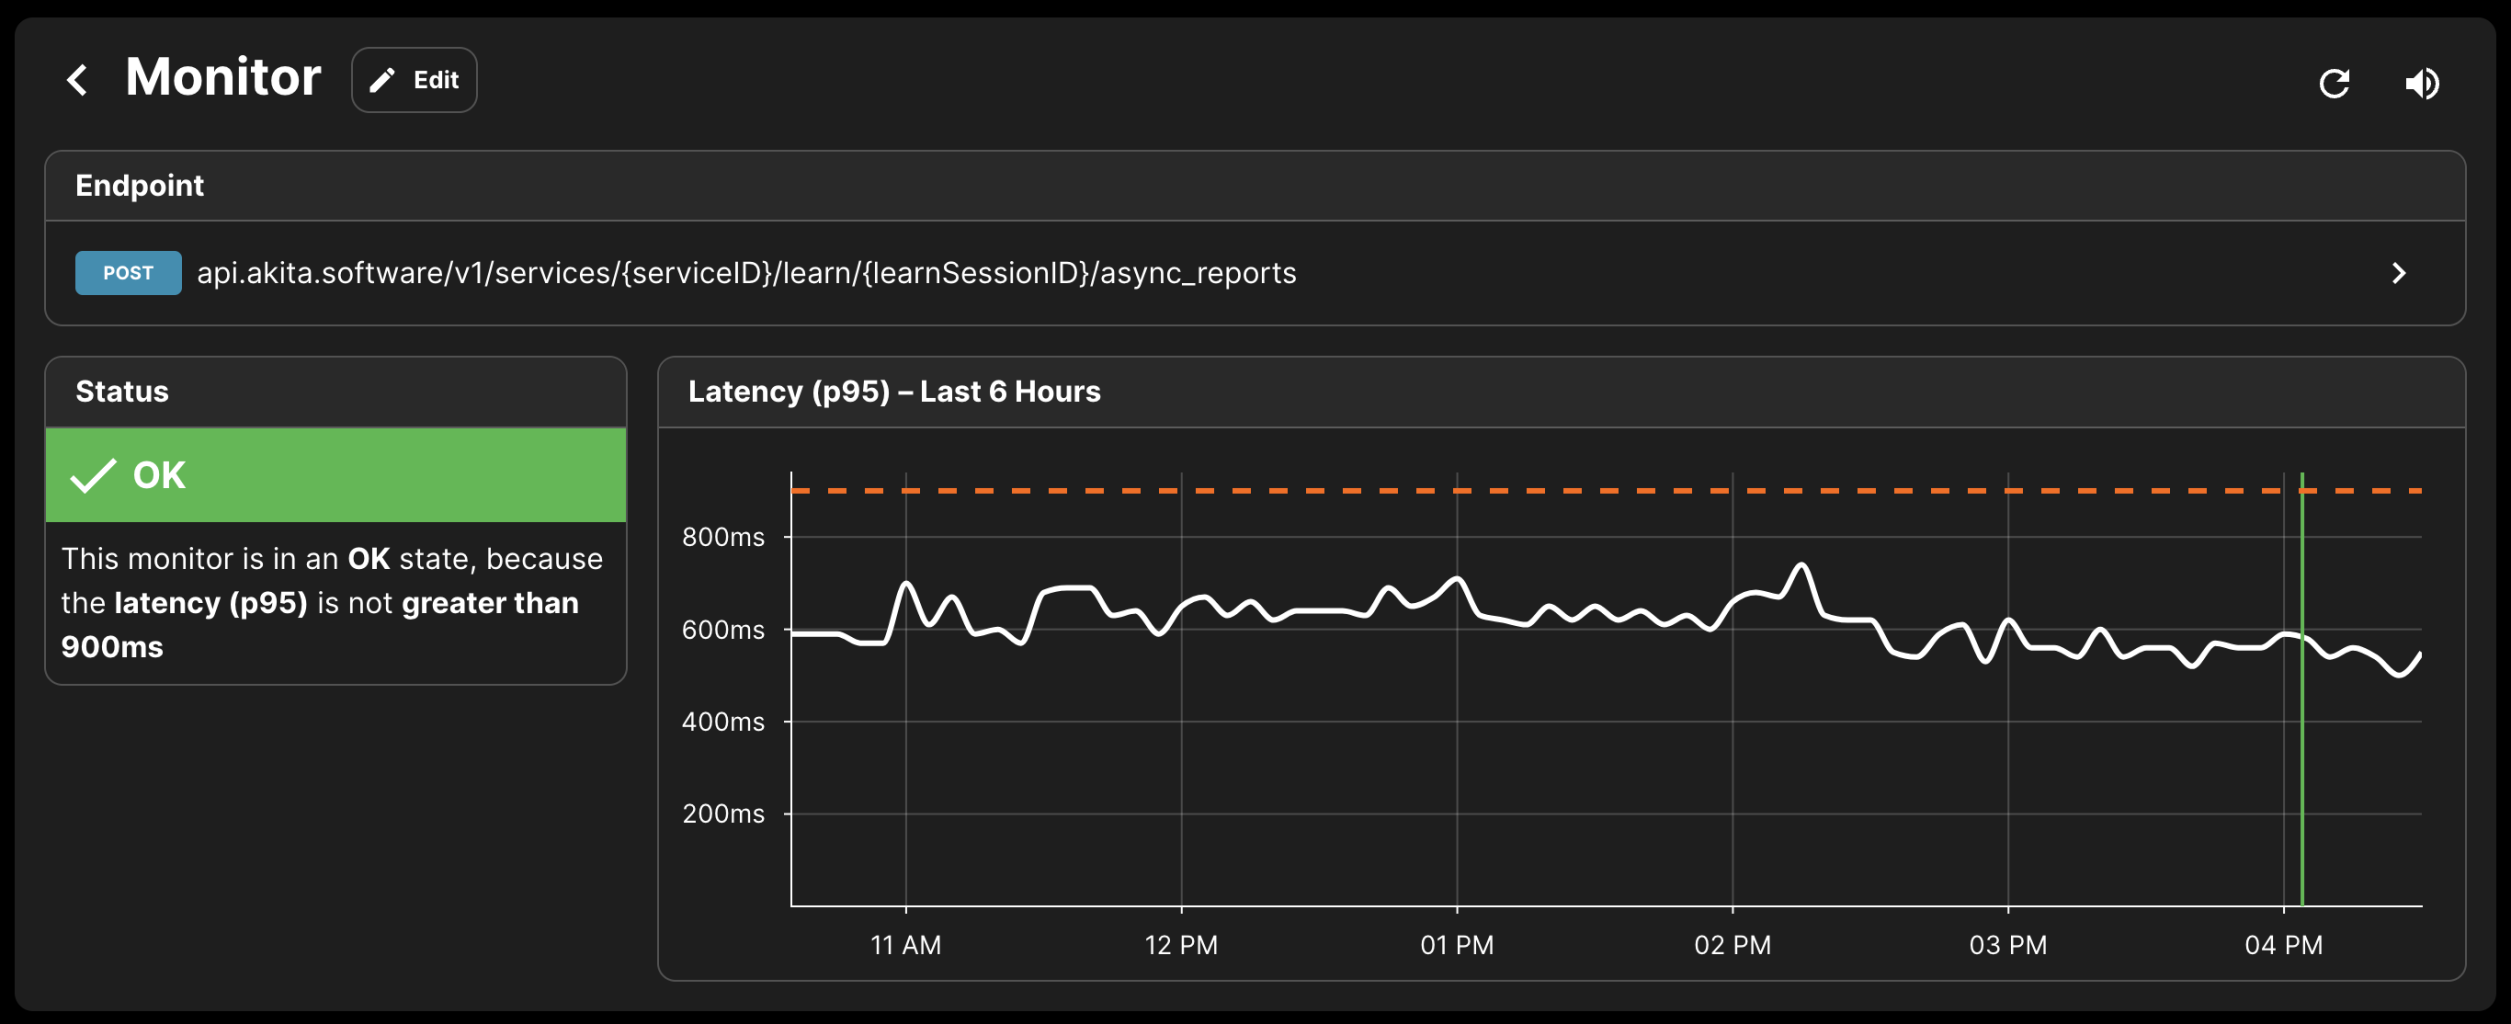
Viewing a monitor.
When a monitor enters an "OK" state (or when it is created), a green marker will be included on the timeline. When an monitor enters an "ALERT" state, a red marker will appear on the timeline. If you're having trouble telling the two markers apart, a description will also appear when you hover over each marker.
Editing a monitor
When viewing a monitor, you can click on the "Edit" button in the upper left-hand corner to change the configuration of your monitor. A monitor's endpoint can't be changed after it has been created, but you can change all the other values as described in the "Creating a monitor" section of this document.
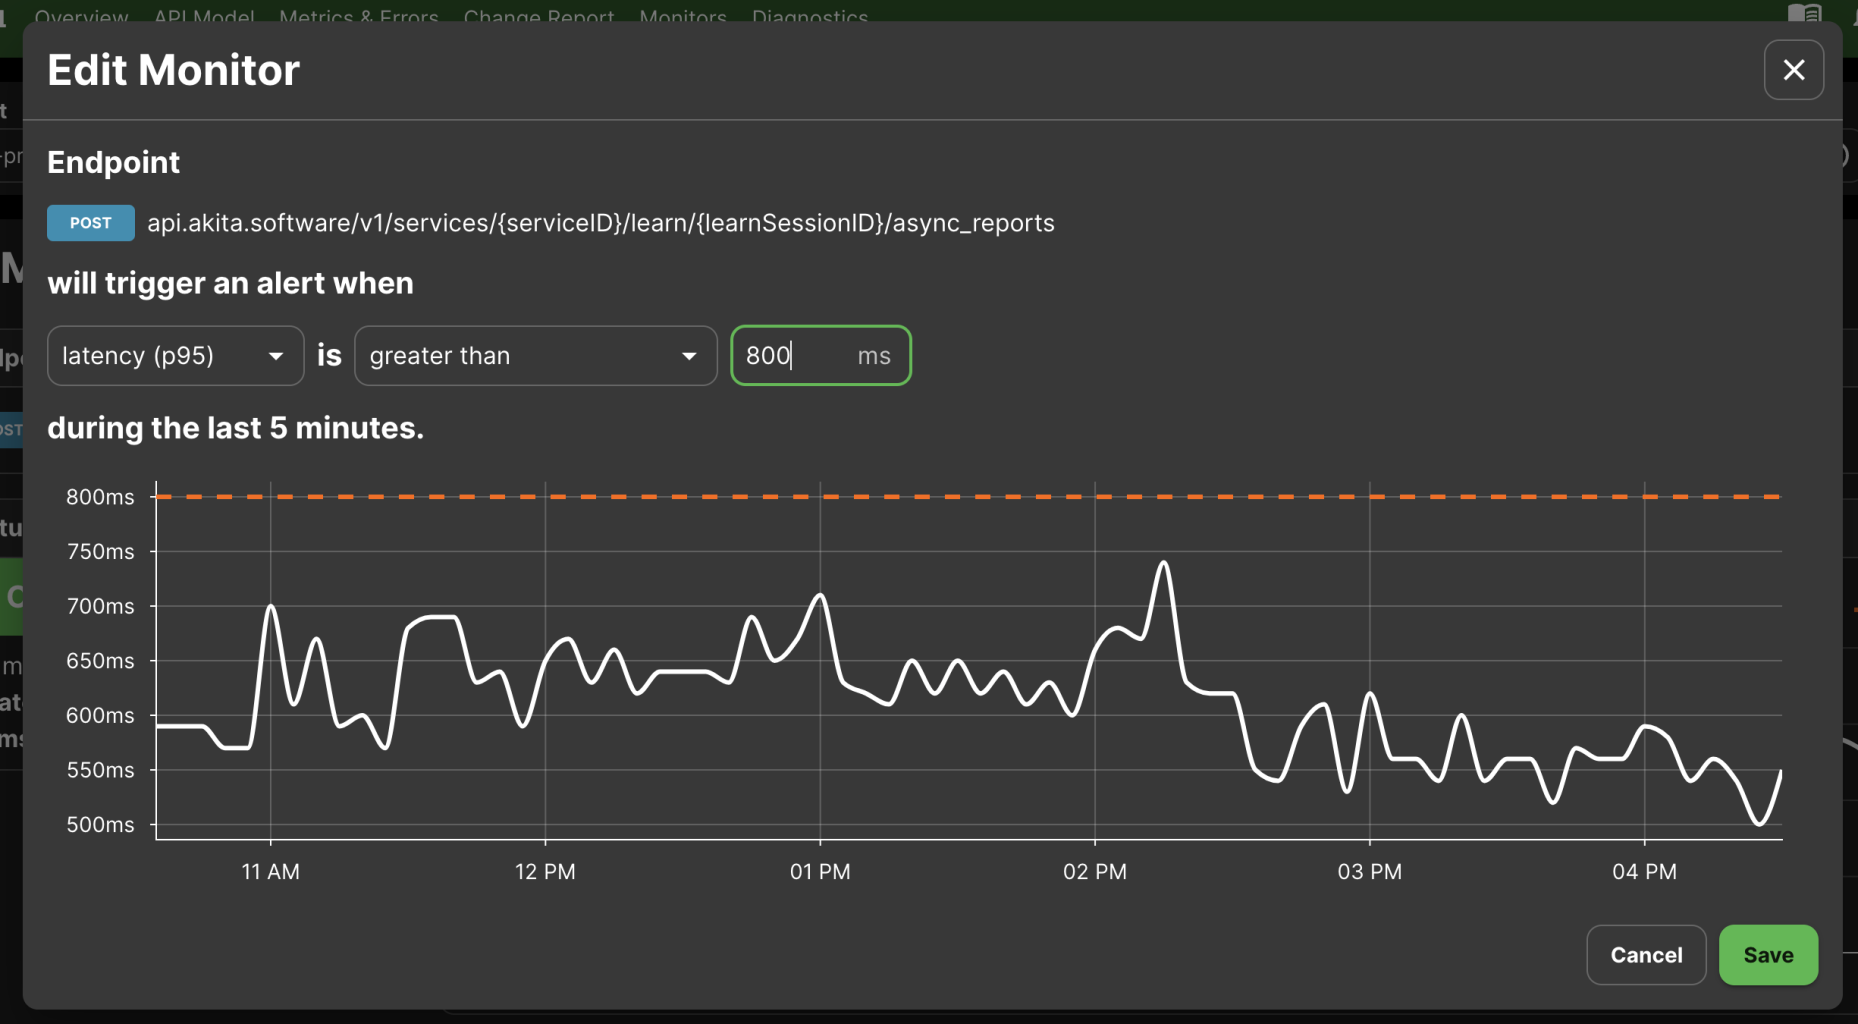
The Edit Monitor dialog.
Muting a monitor
Once you've been alerted by a monitor, you may want to mute it to avoid being interrupted while resolving an issue. You can choose to mute a monitor for 1 hour, 3 hours, 6 hours, 12 hours, 1 day, or forever. You can access these options by clicking on the volume icon next to your monitor, either in its entry in the table on the Monitors page, or in the upper right-hand corner while viewing a monitor.
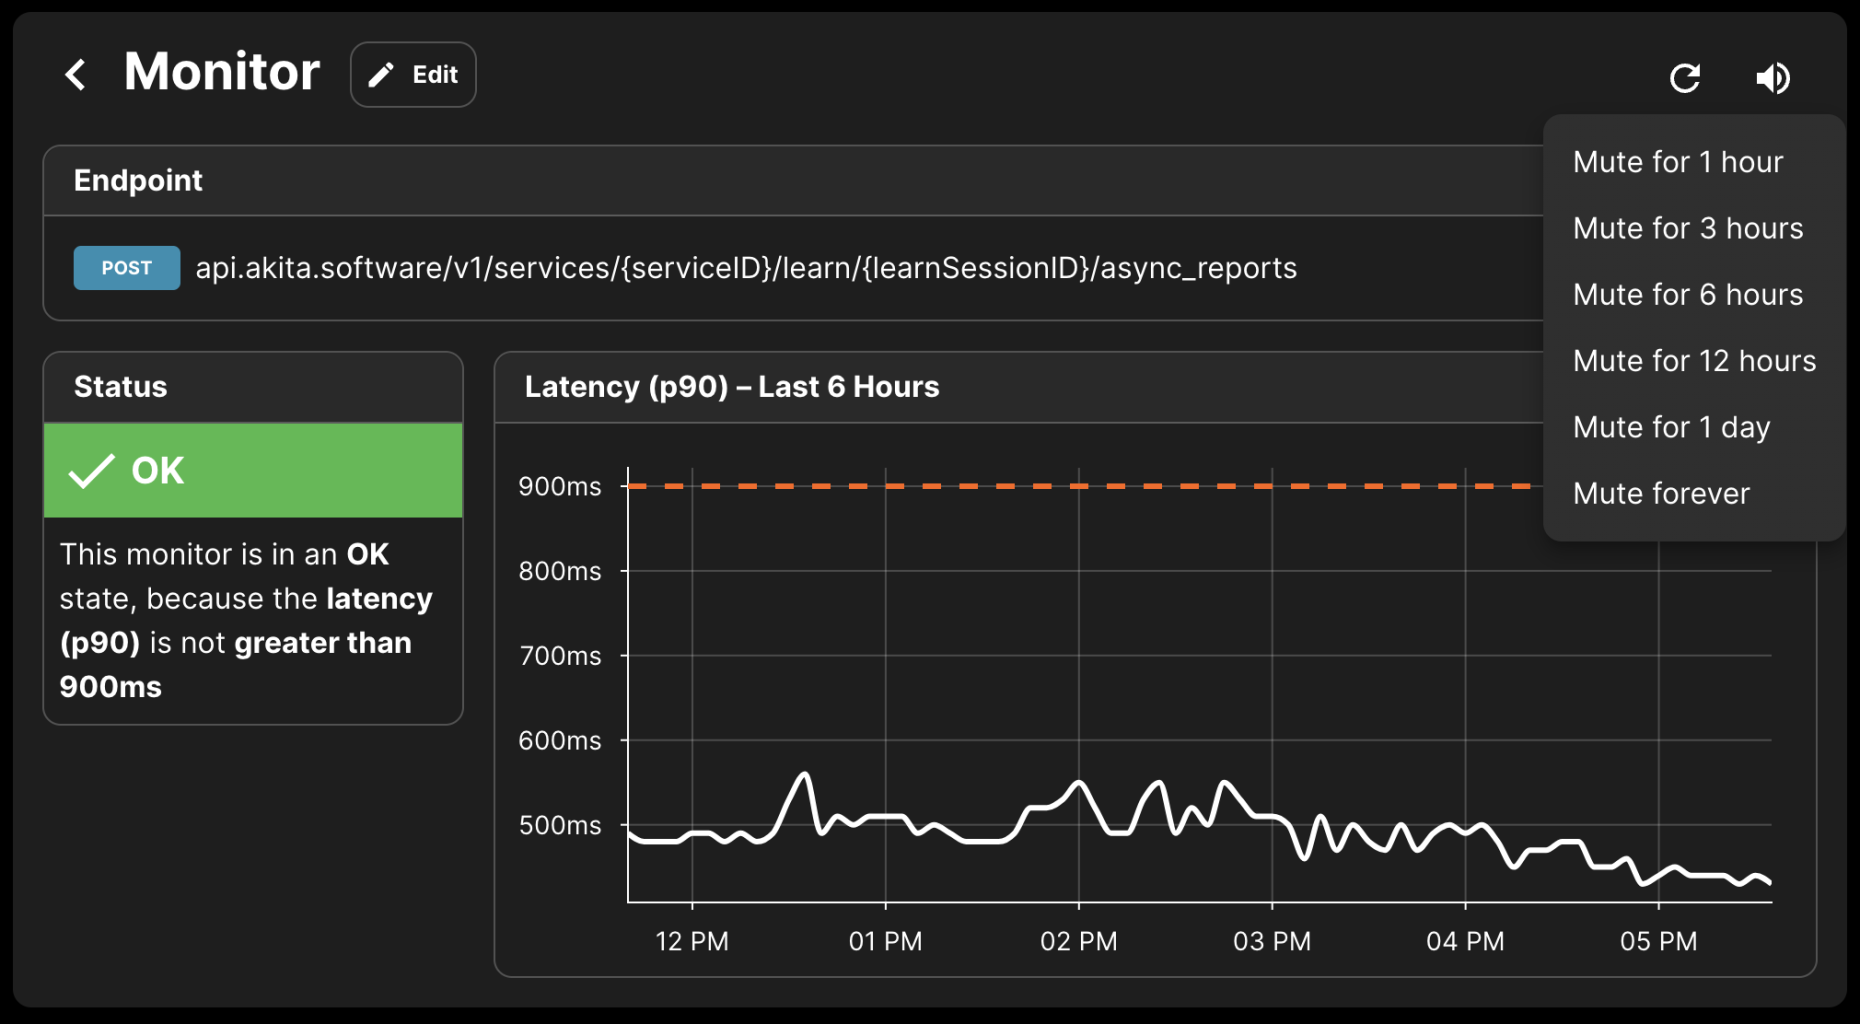
Muting a monitor.
Updated almost 3 years ago