View and Share API Models
Once you've installed your Akita Agent, you should start seeing your model come together. After setup, you should expect it to take about ten minutes to build your first model. After that, your model should refresh every 2-3 minutes.
View Your API model
If you head over to the Akita console, you'll be able to see what Akita has observed and what insights are available.
Insights take time
It can take up to 10 minutes to build your first model. If you don't see it, hang tight!
If you are still having trouble, check out our Troubleshooting guide for help.
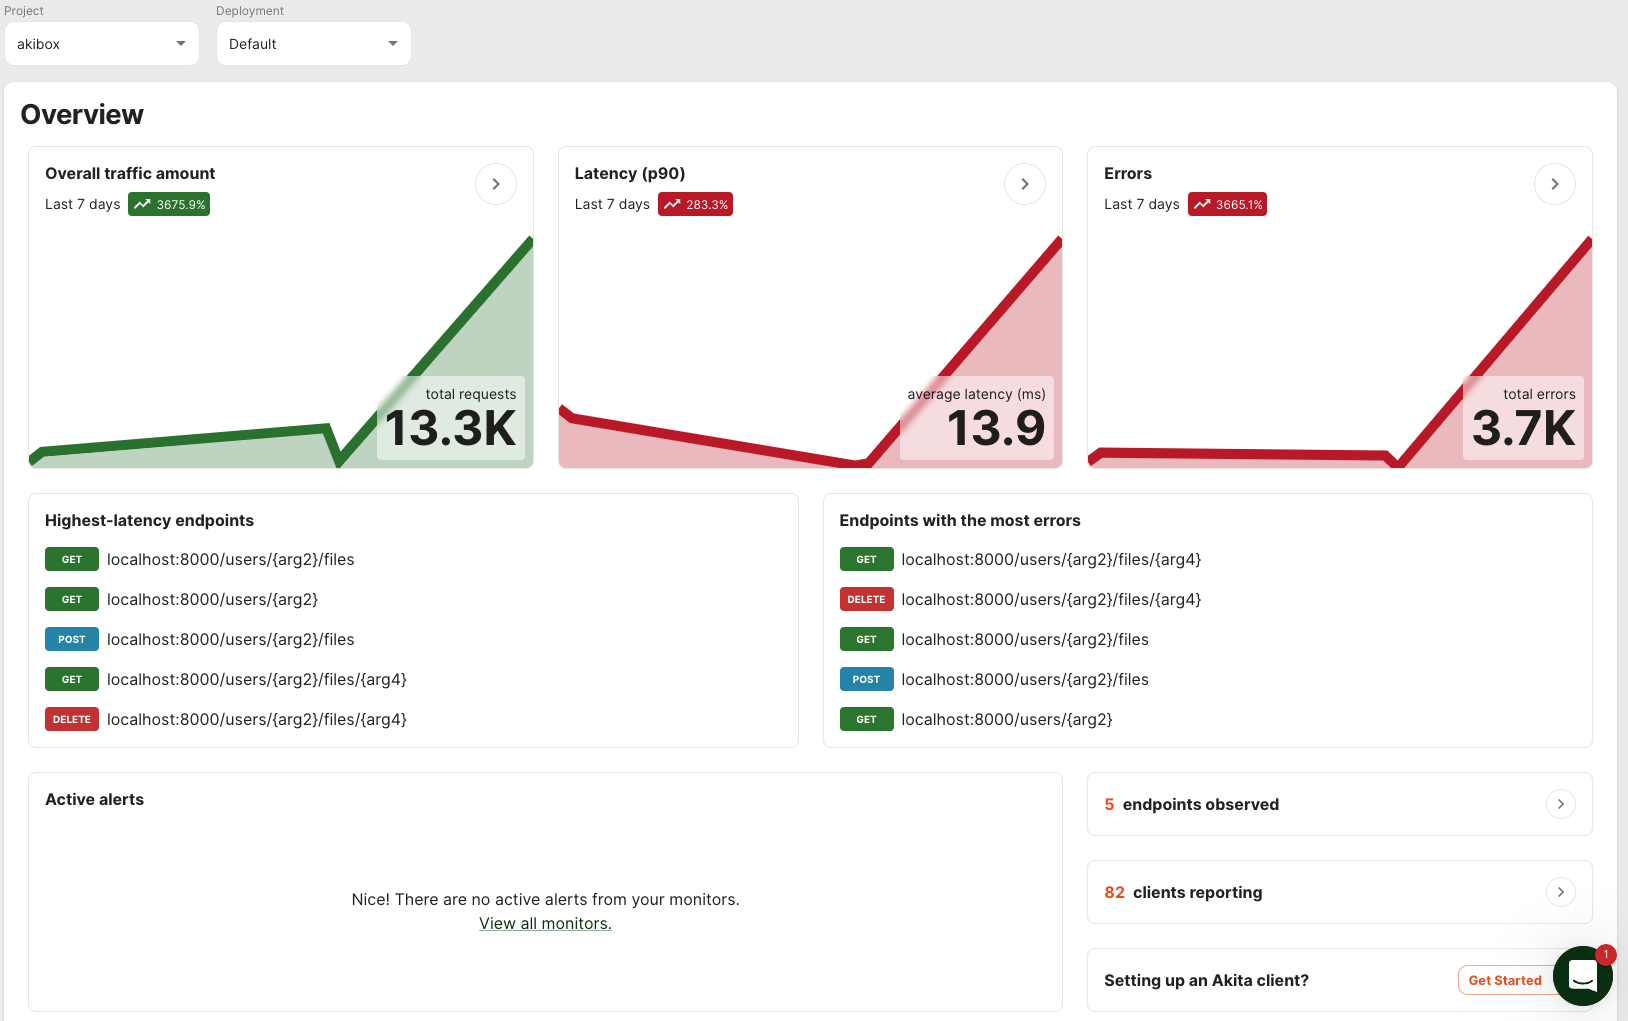
When you log in for the first time after you've installed the Akita Agent, you'll see our Overview page, though yours might be a bit emptier until Akita's had enough time to populate the relevant information.
Next, you'll want to check out the API Model page by clicking on it in the top navigation bar. You can always get back to the Overview page by clicking "Akita".

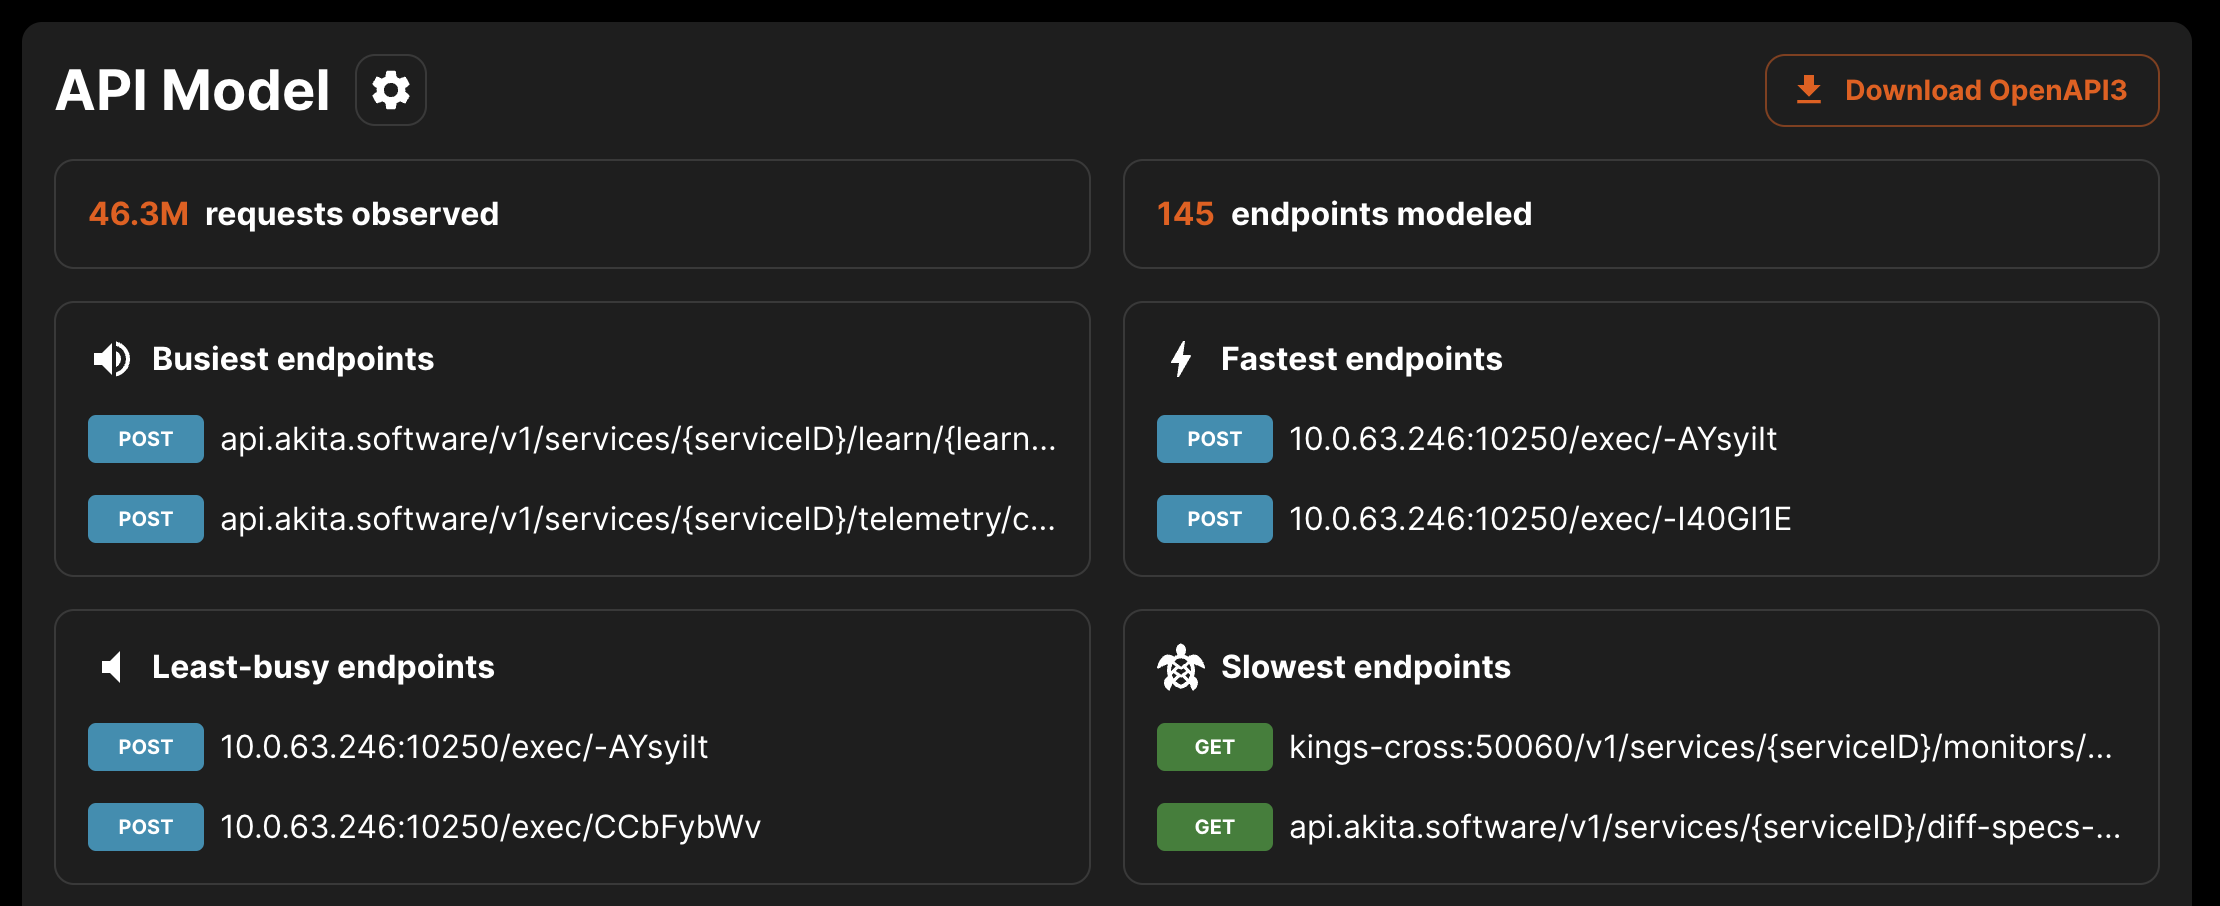
At the top of the API Model page, you'll see a count of the total endpoints and total traffic that Akita has observed so far, and then a list of the top two busiest, quietest, fastest, and slowest endpoints. You'll also see a button to download the OpenAPI spec of your model.
Below this overview, you will see a list of hosts and endpoints that Akita has observed. Each endpoint shows its P90 latency and the number of requests observed, as well as the structure and types of its requests and responses.

You can drill into each endpoint to learn more about it.
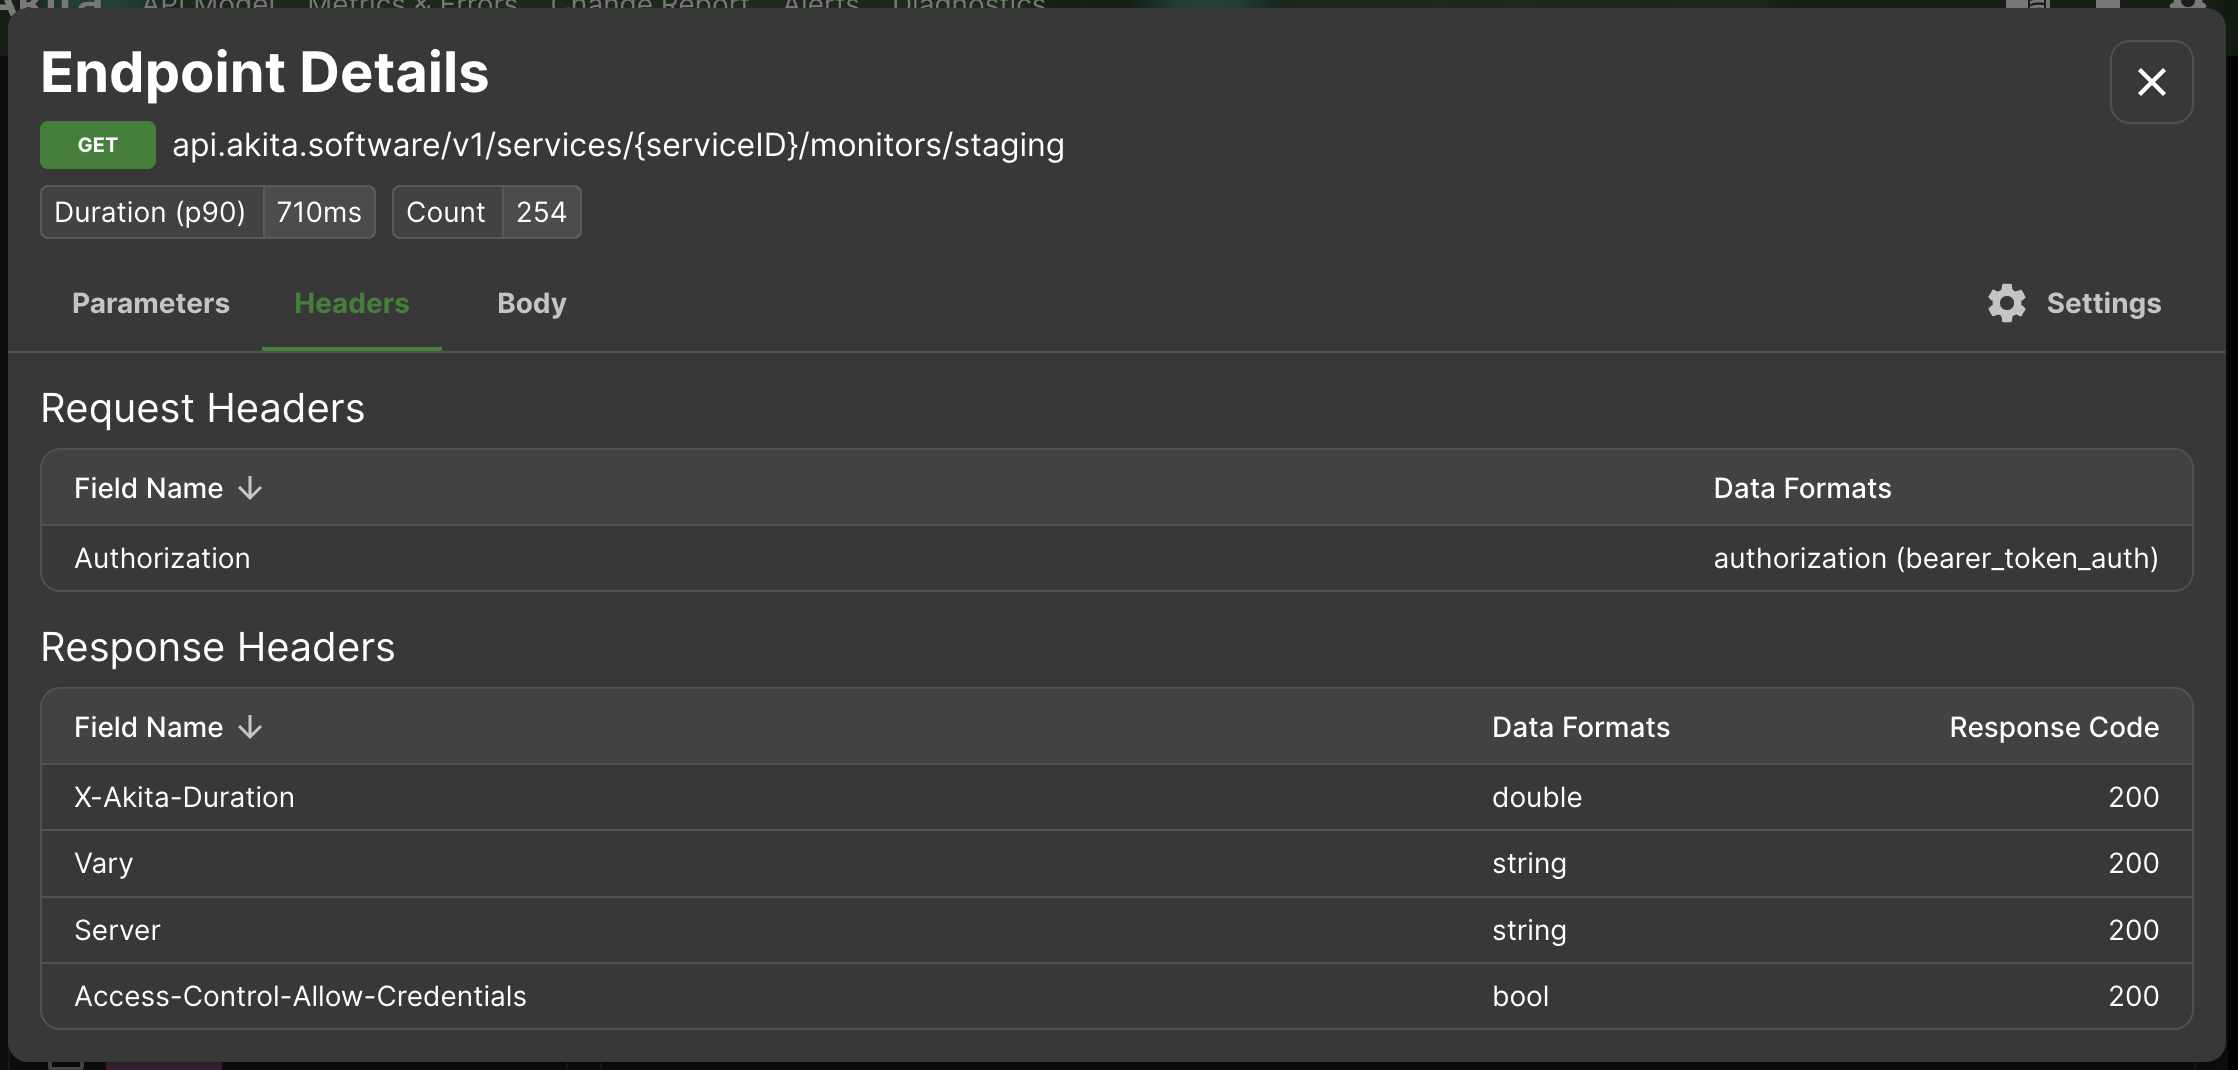
Each endpoint shows the path and query parameters, headers, and body fields expected in a valid request, as well as the kinds of responses the endpoint supports.
Fields are labeled with their types (string, int, etc.) and, when possible, specific data formats, like email, date, timestamp, phone number, and so on. You can find a complete list of data formats in Supported Data Formats .
Downloading and Sharing
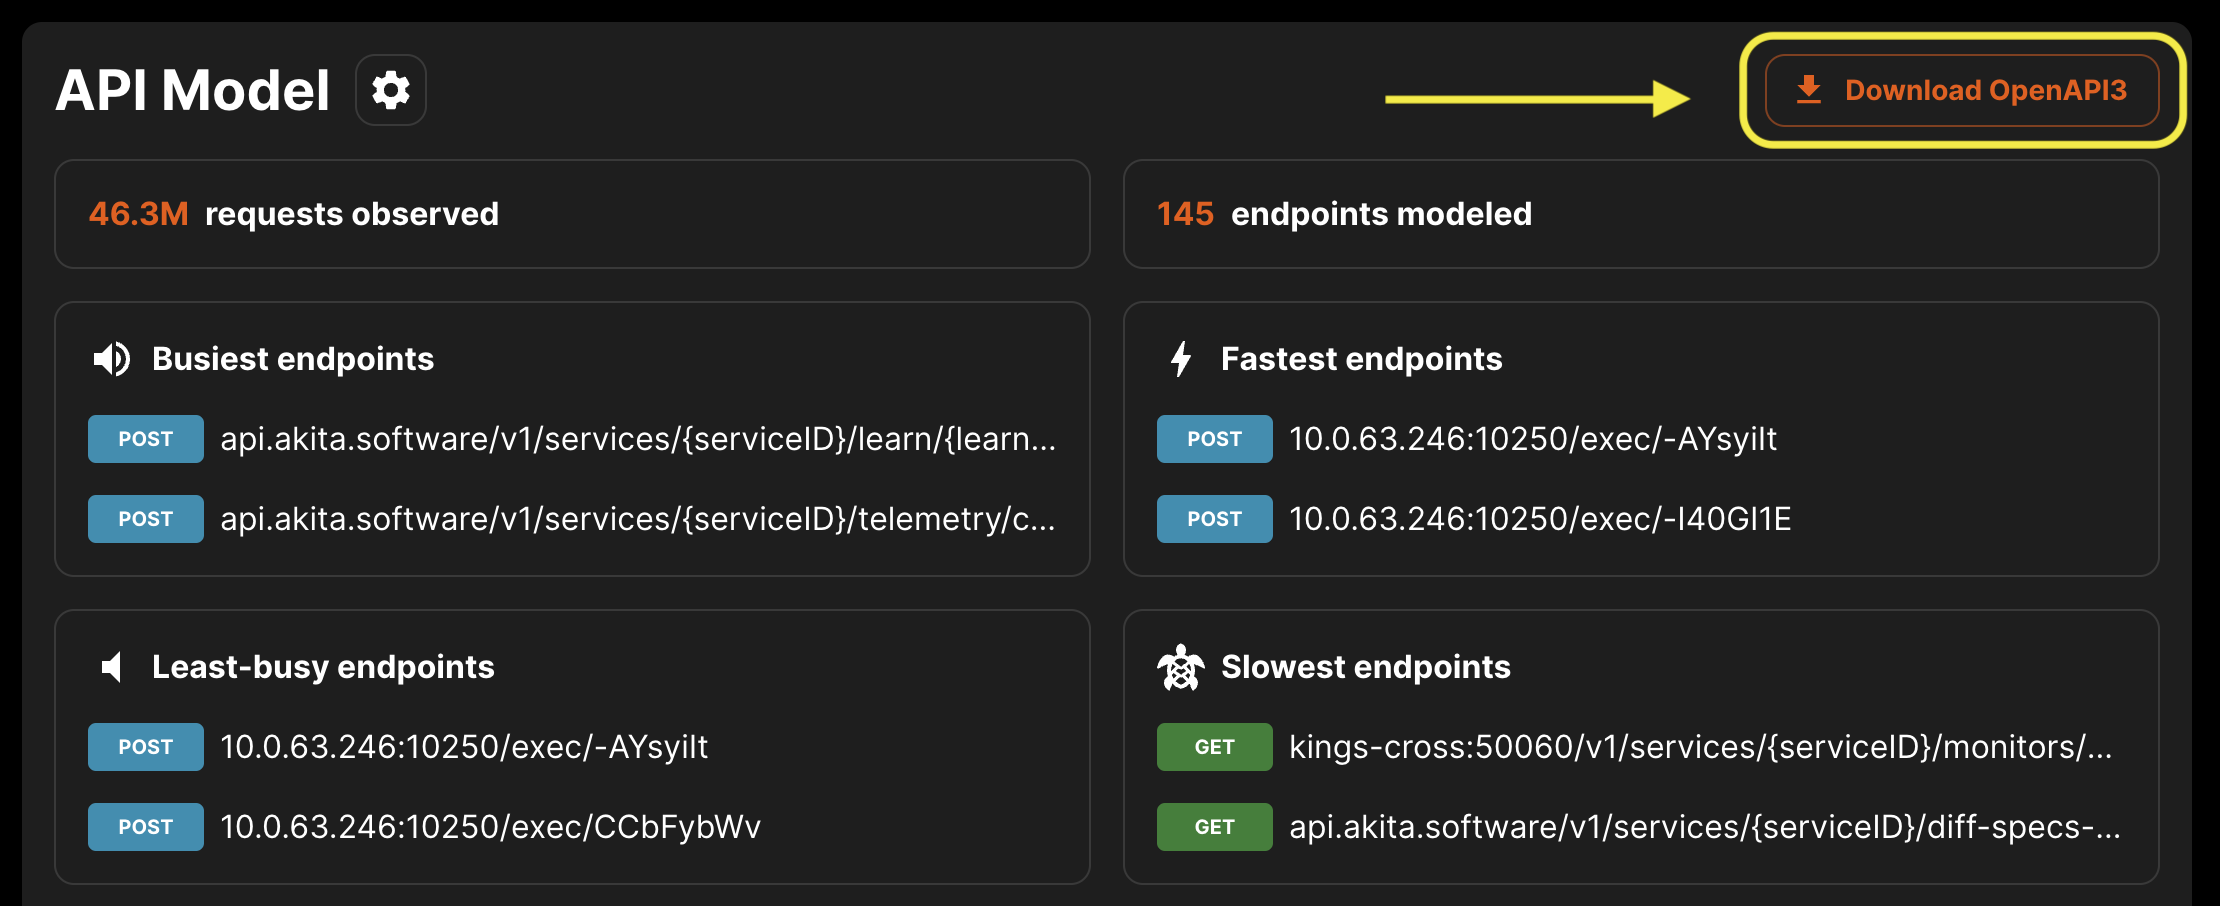
Akita represents API models as annotated YAML files that you can download and use anywhere OpenAPI3 specs are used. What you see in this model is also what Akita uses for semantic diffing across API models. You can download a spec of your API model using the "Download OpenAPI3" button at the top of the page.
Dark Mode
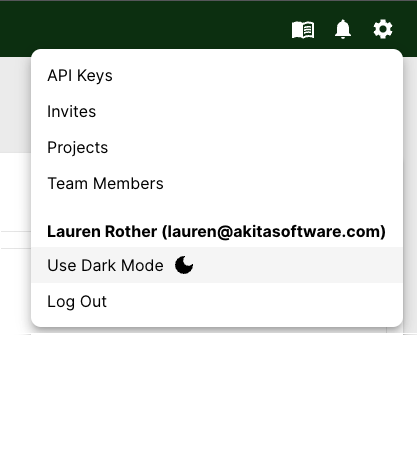
You can view the Akita app in Light Mode or Dark Mode, by selecting "Use Dark Mode" or "Use Light Mode" from the Settings menu.
Updated almost 3 years ago