Troubleshooting
While our goal for getting started is to be as simple as dropping our Agent into your app's environment, we know that all environments have their unique implementations, and so getting started might run into a snag from time to time.
This page will cover the most common issues we see when users try to get started.
- I'm getting an error about
failed to list network interfaces - I'm getting an error about
invalid credentials - The Akita Agent is not capturing traffic
- My traffic is encrypted
- I'm using the Chrome Extension, and just see a "sit tight" message
Insufficient privilege
In order for the Akita Agent to see how your API is behaving, it needs certain permissions. Specifically, the Akita Agent needs the CAP_NET_RAW capability enabled. If you are running as the root user, this should be enabled automatically.
If you see an error about failed to list network interfaces, then it is very likely that CAP_NET_RAW is not enabled.
If you cannot run as root, or would like to ensure that the CAP_NET_RAW capability is set properly, run the following command to enable it:
setcap cap_net_raw+e /usr/local/bin/akita
Invalid credentials
If you encounter an error that reads: [ERROR] failed to get list of services associated with the account: Invalid credentials, then it it likely that either the Akita API key or key secret was entered incorrectly. In a Docker context it would probably due to miscopying the key ID or key secret.
First, if you saved your key ID and secret somewhere, please try the installation again.
If that doesn't work, please regenerate your API key and secret, and try the installation again with the new key ID and secret.
If you see a different message about the key or secret being missing, please check the environment variable name to ensure that it is correct. If there is a typo in the environment variable name, the Akita Agent will not be able to find the API key and secret.
Not capturing traffic
This section describes what to do if you have started the Akita Agent but no metrics or models are appearing in the Akita Console.
Check the client status
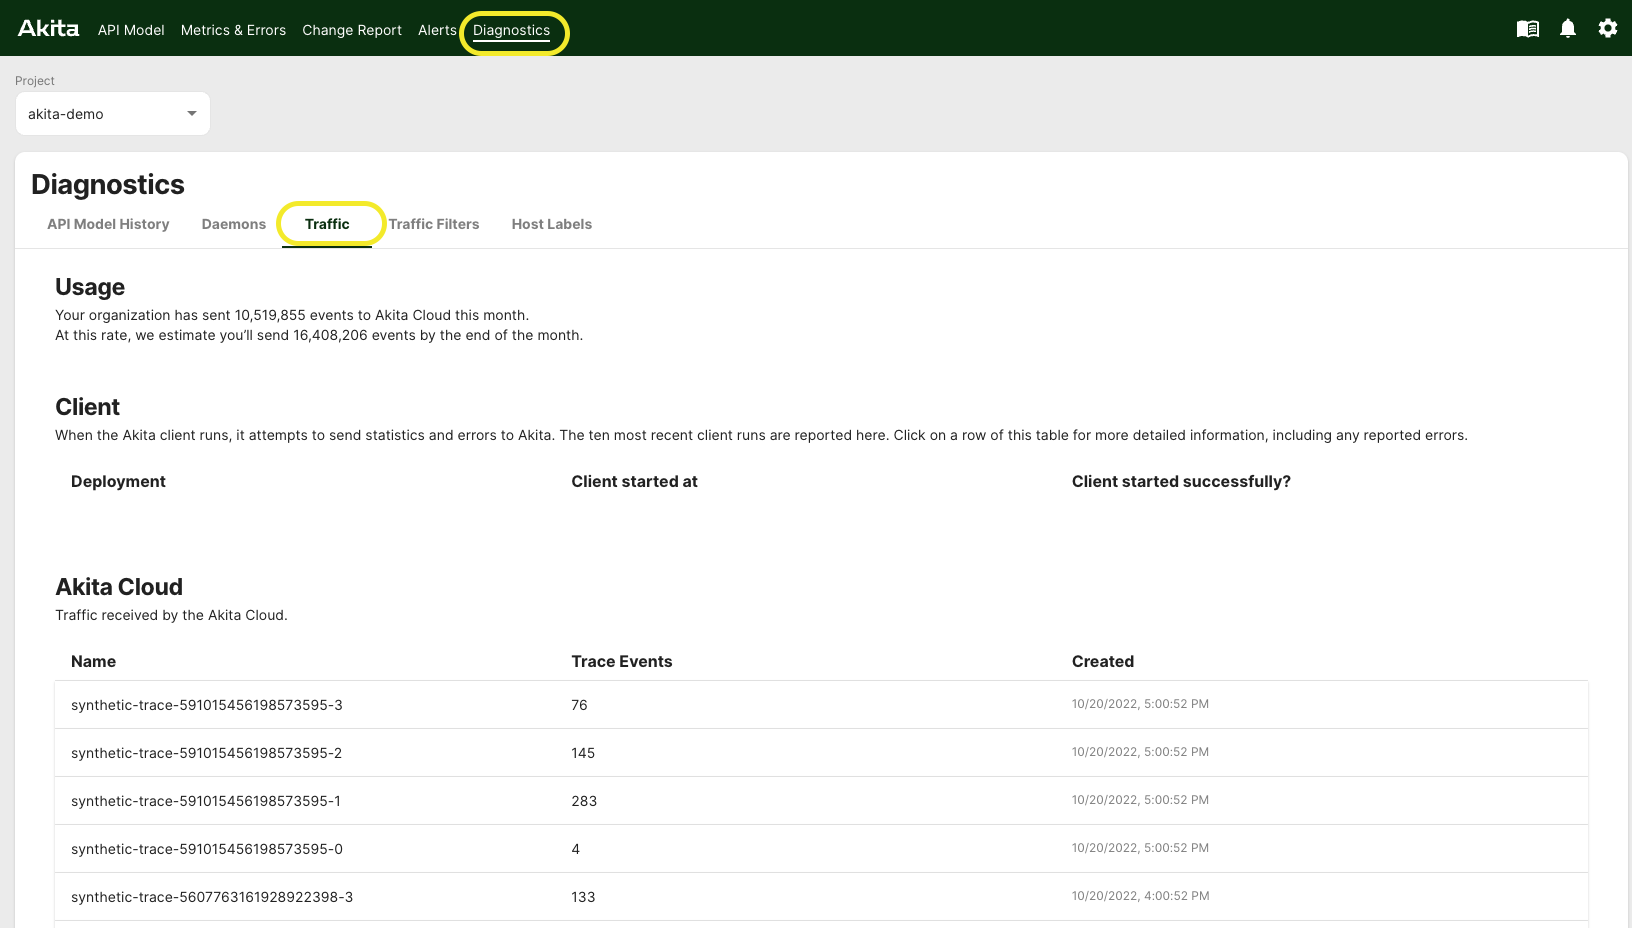
If nothing is showing up, one reason could be that the Akita client isn't seeing the traffic it's expecting to see. In the Akita Console, navigate to the "Diagnostics" link in the sidebar, and select the "Traffic" tab.

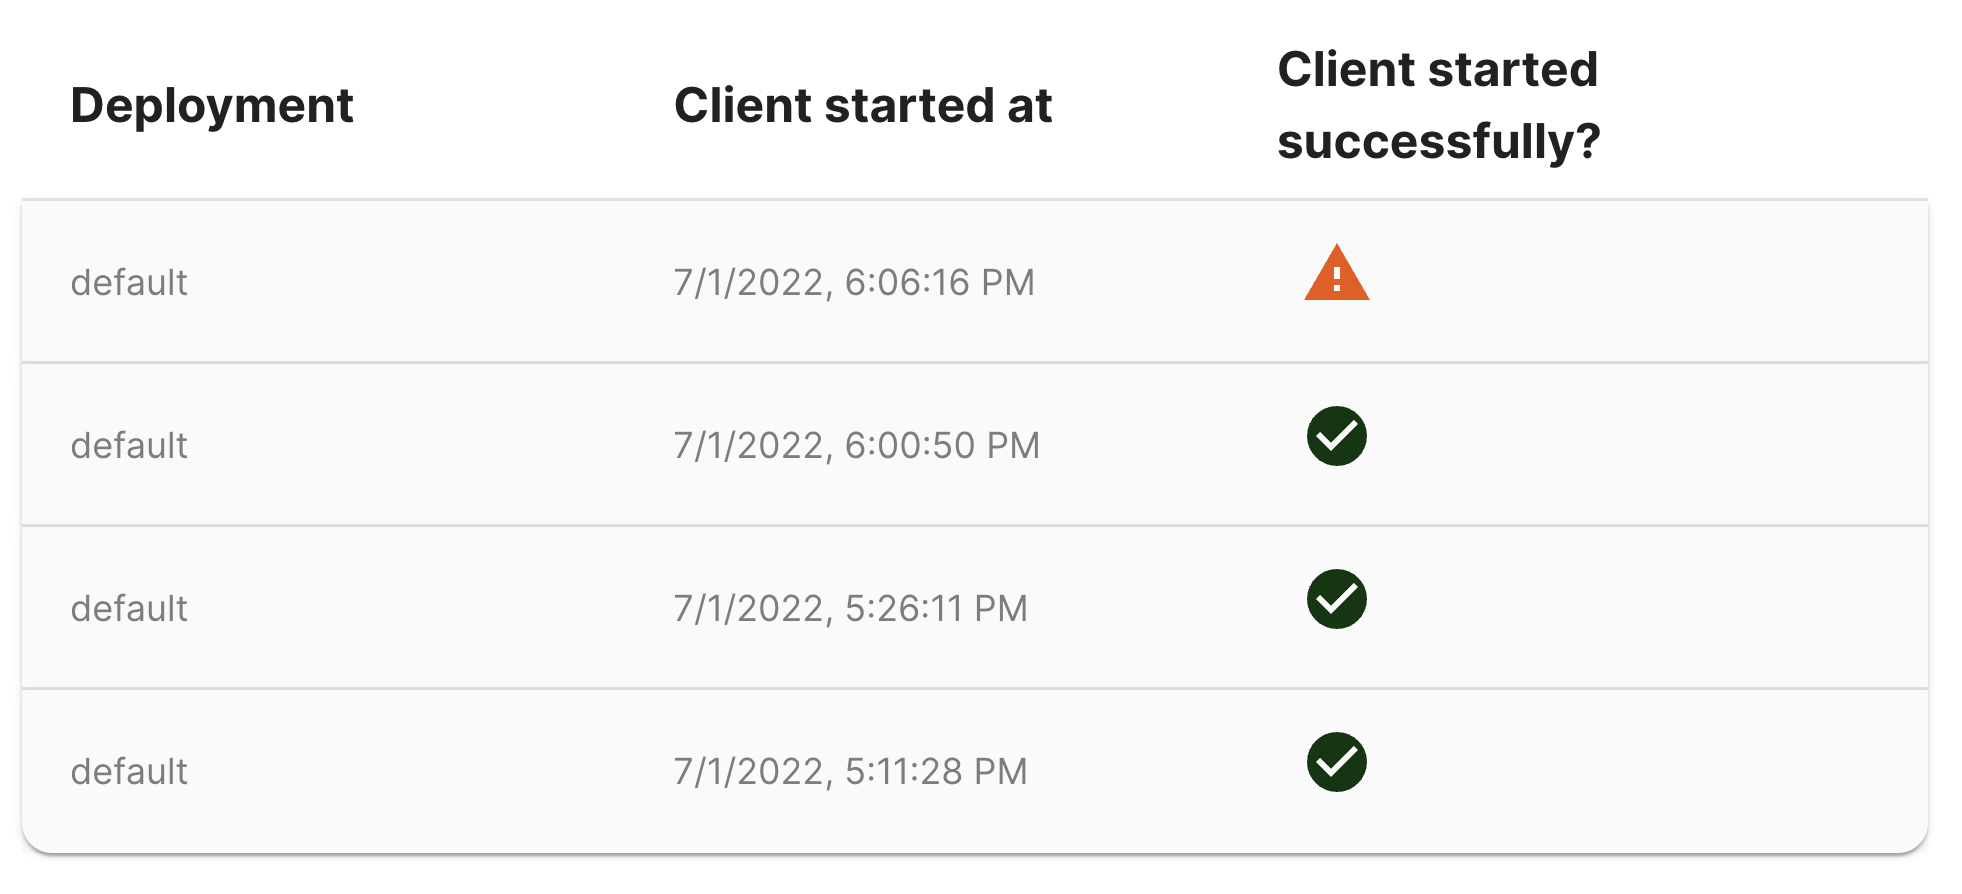
Each time an Akita Agent starts, it registers with the Akita backend and monitors packet capture health over the course of one minute after initialization. Agents that fail to capture traffic within the first minute will appear with a warning status on this page.

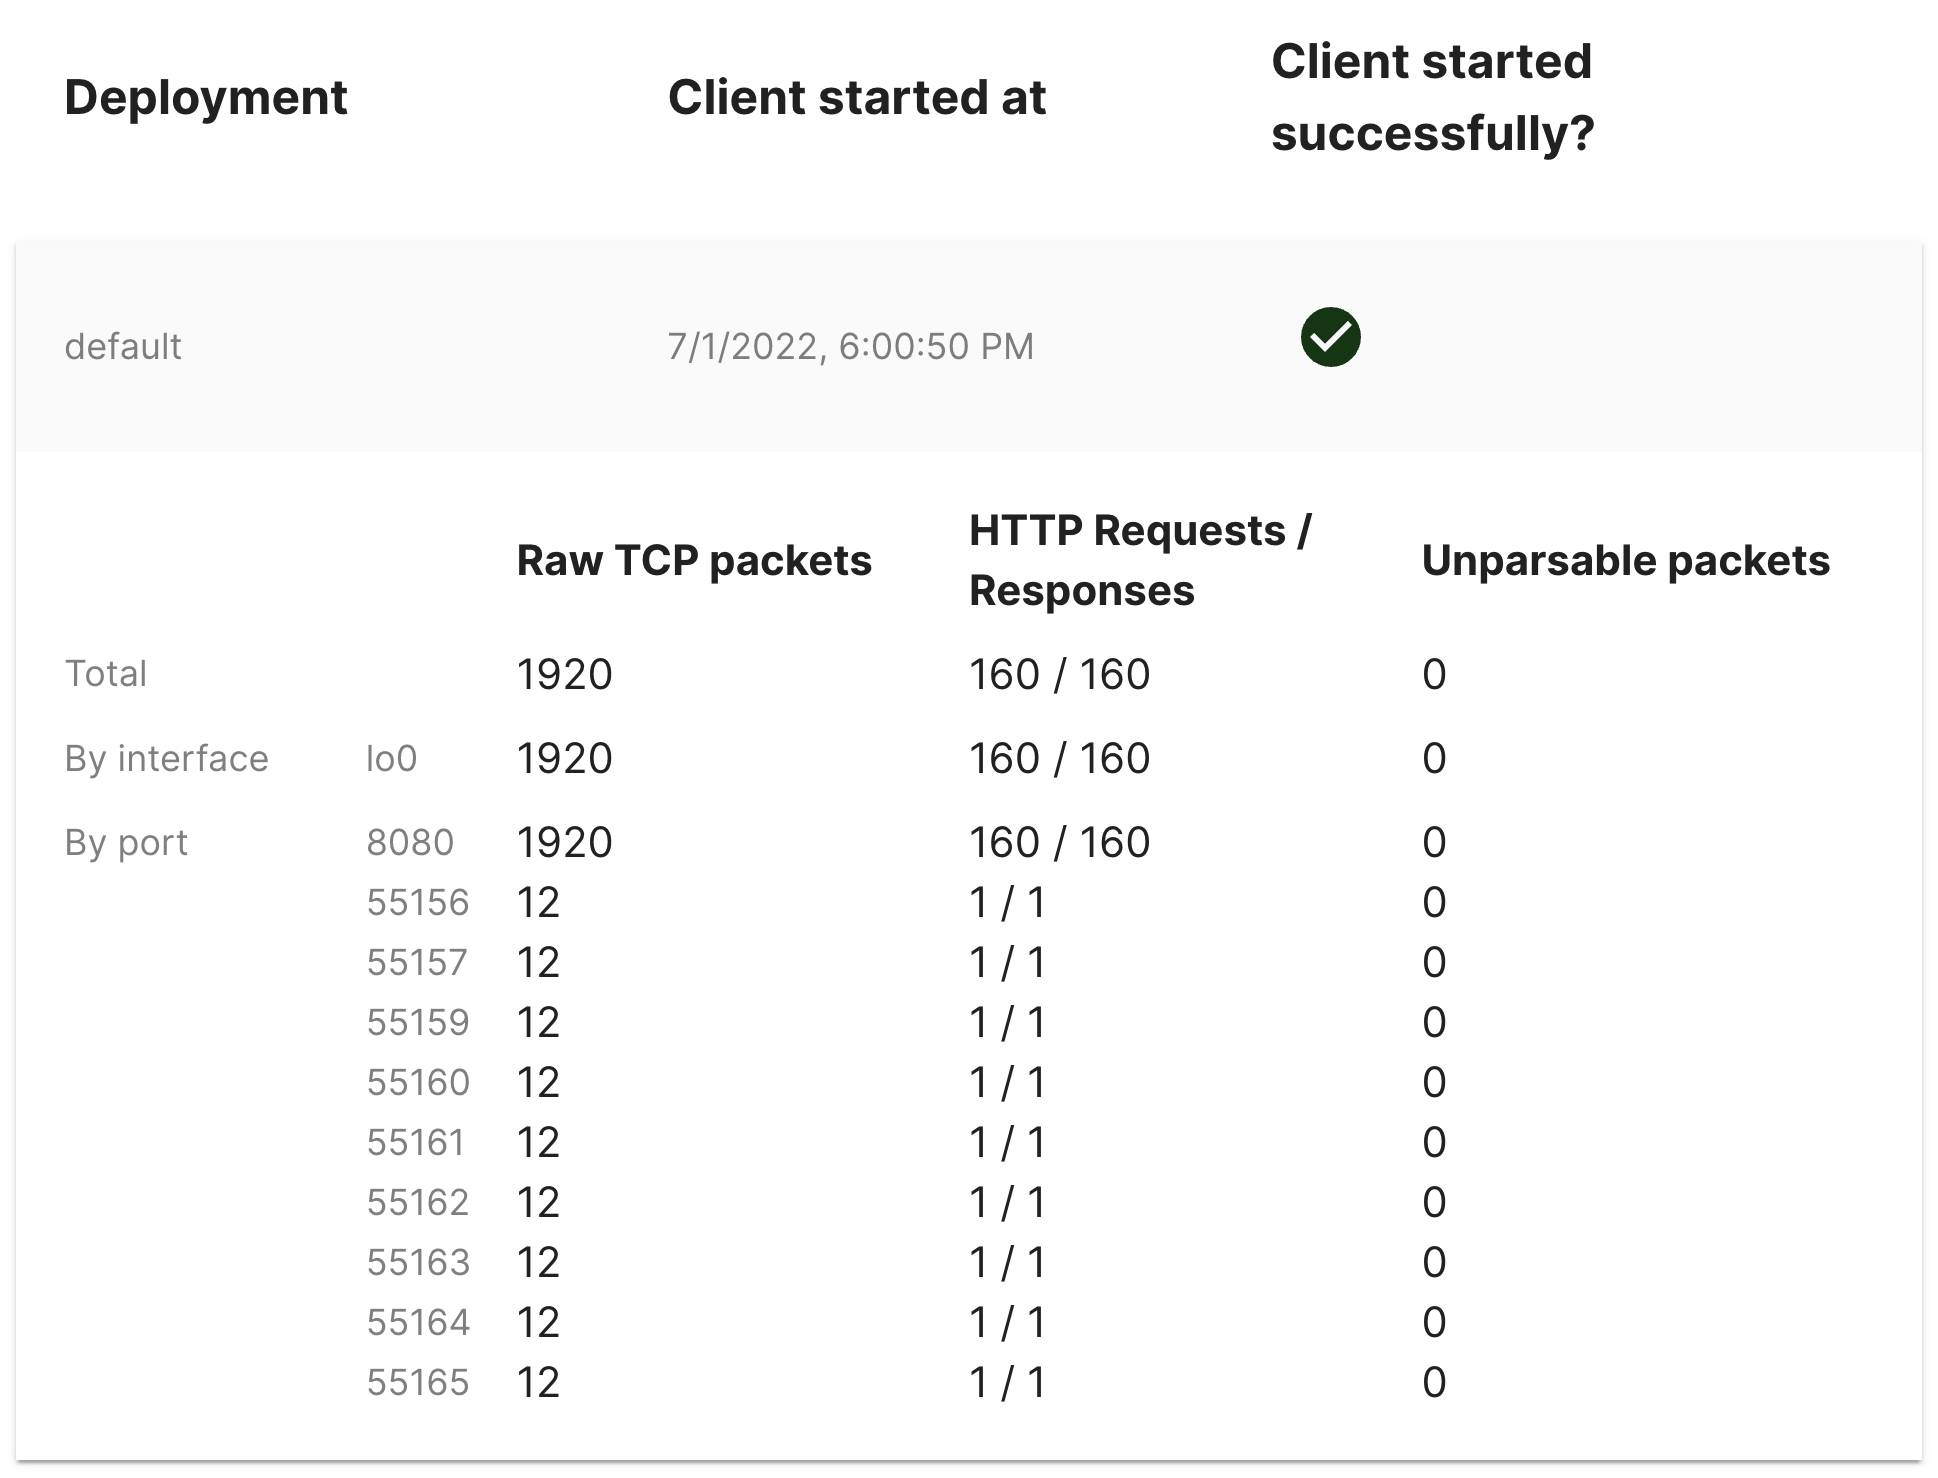
Each row expands to show warning messages (if applicable) along with packet capture statistics.

Here are a few things to look for:
- The Raw TCP packets count is zero. This means that the Agent did not see any traffic. If you are using the
--filter flagor have specified an interface to listen on, make sure they are correct. To make sure you're not filtering too much, try removing these flags to capture traffic on all ports and interfaces. - The Unparsable packets count is greater than zero. This often means the Akita Agent is trying to parse encrypted traffic. If the HTTP Request/Response count is zero, then all your traffic is likely TLS traffic. See above.
Check for log messages from the Akita Agent
The Akita Agent will show an error if the collection of API traffic fails or results in an empty trace. In addition to the issues covered above, incorrect permissions and invalid credentials, check that the TCP port number you gave was correct. If it is incorrect, the traffic will not be included in the trace and you will see an error No inbound HTTP calls captured.
See the Diagnostics section in the apidump command for more information.
Test that Akita saw all your endpoints
Once you run Akita, here’s how you can test that your setup worked. First, use apidump to capture traffic to your service and store it in a local trace.
# 1. Start capturing traffic:
akita apidump --filter "port ${YOUR_PORT}" --out path/to/local/dir

# 2. Exercise your service's API.
# 3. Hit Ctrl+C to stop capturing traffic.
Encrypted Traffic
If your model is missing endpoints that you expect to be there, or is completely empty, it may be because you are trying to observe your API at a point where it is encrypted. If this is the case for you, you can still potentially use Akita in other ways, or by changing where you run Akita.
There are several reasons Akita may not be seeing traffic:
- Permissions issues which you can read about solving above.
- Data formats that the Akita Agent doesn't recognize, such as gRPC/GraphQL.
- Actual encrypted traffic.
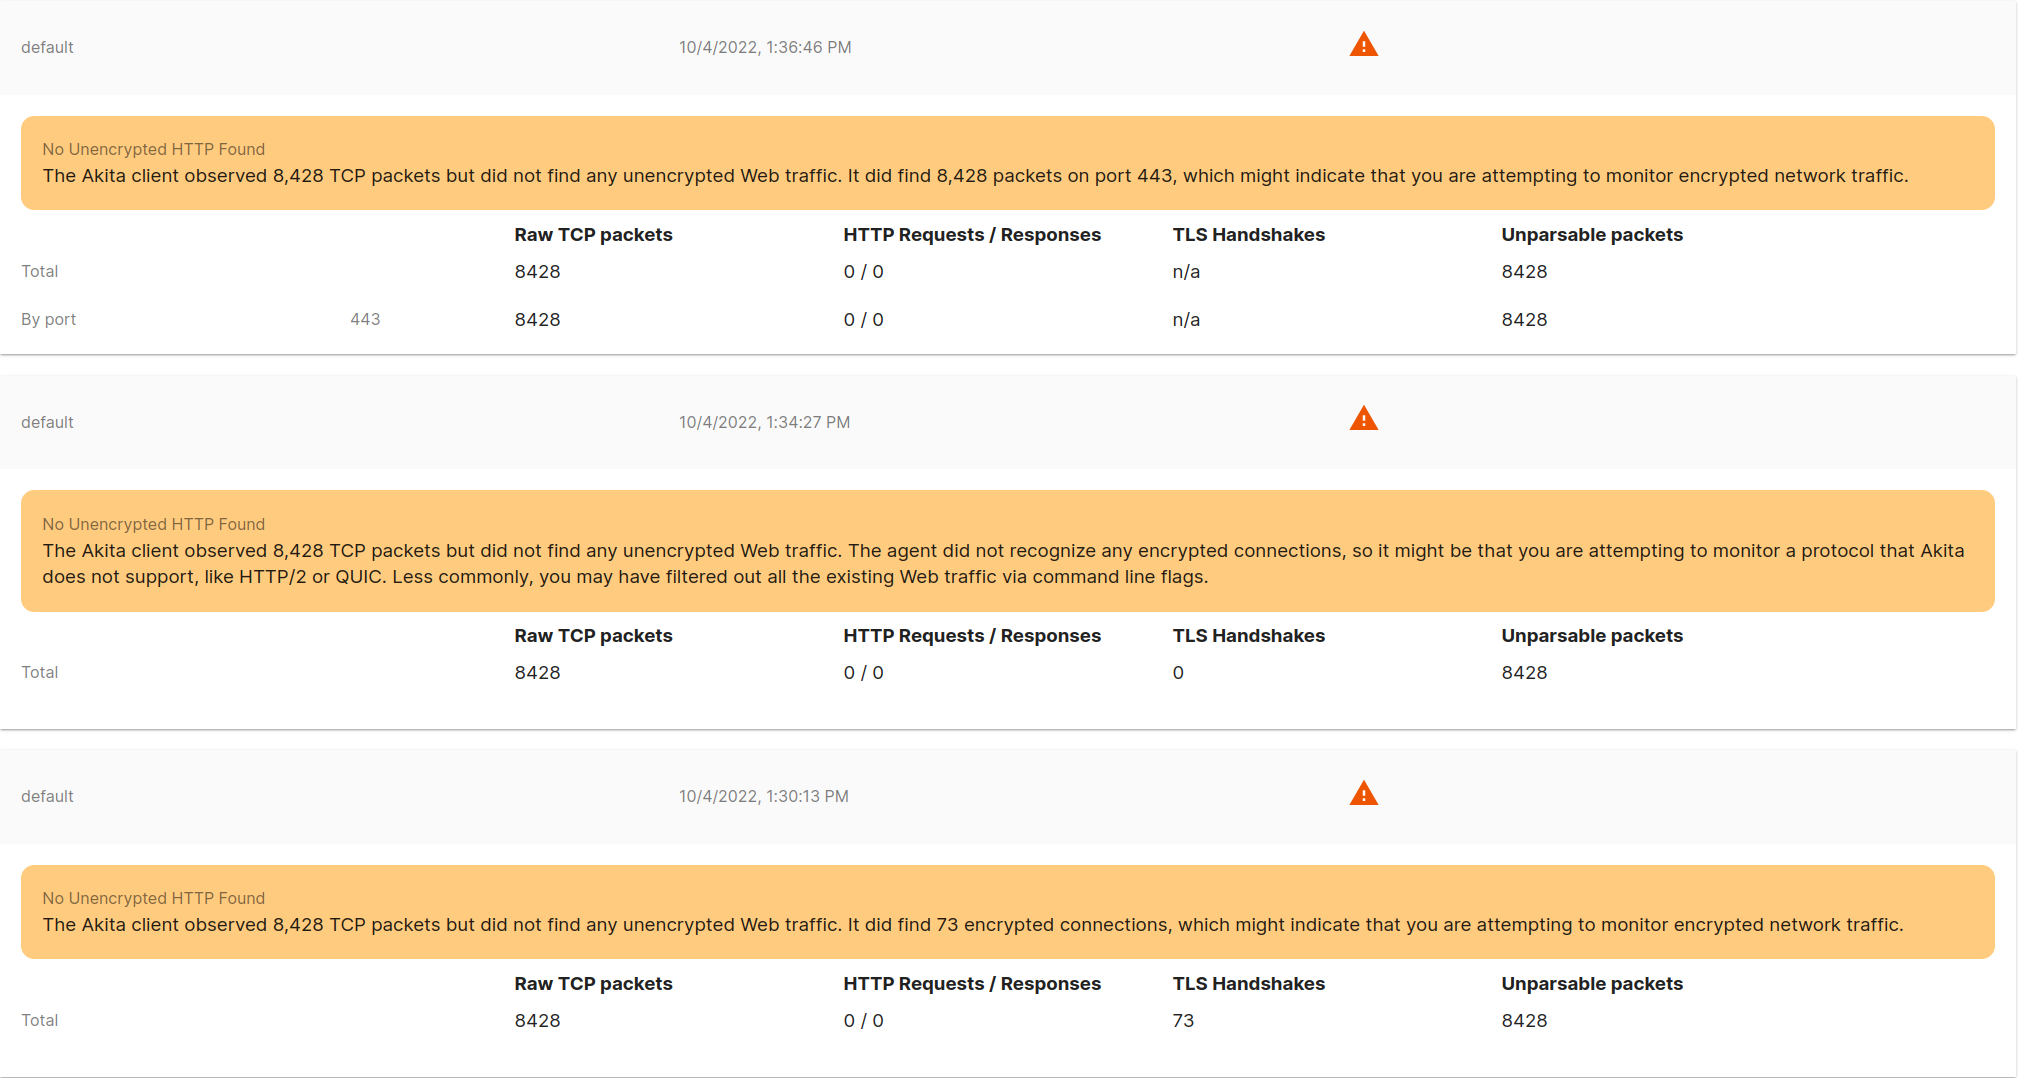
To determine which of these applies to you, visit “Diagnostics > Traffic” in the Akita web console, and click on one of the client reports listed there. This will indicate whether Akita saw any traffic encrypted with TLS.
If you encounter an error saying something like The Akita client did not observe any network traffic, or ... but did not find any unencrypted traffic, then you are likely running the Akita agent on a different network from where your API is running.

If possible, try to re-install your Akita Agent on the same network as your API. If you have a private Docker network, check out our docs for getting started on an Internal Network in Docker. Otherwise, look over our DIY Akita Agent Integration instructions.
If your environment is set up to be fully encrypted by design, check out your additional options below.
Use the Akita Chrome Extension while using your site
Akita has built a Chrome extension that captures API requests and responses live in your browser as you’re using a web site: Akita OpenAPI Spec Generator. You can try this first to get a sense of how Akita will work, before attempting a deeper integration into your production systems.
Deploy Akita as a Sidecar
The normal onboarding instructions connect Akita to a host network. If the traffic from the outside world goes through a service mesh or reverse proxy, then the unencrypted traffic from that proxy to your application goes over network local to the container or pod.
Instead, you can deploy Akita as a sidecar to your application’s container, so that it can see that unencrypted stream of traffic.
For Kubernetes, see Sidecars for Single-Service Kubernetes or Kubernetes with Istio/Envoy.
For other Docker platforms, see Docker Run for instructions on attaching Akita to a specific container’s network stack.
This technique will not work if traffic between the proxy or service mesh goes over a Unix Domain Socket (a named socket) instead of the local network. It is meant for configurations where your application is listening for unencrypted traffic on a network port, but communication from the outside world is handled by other software.
Add a Reverse Proxy
If HTTPS currently terminates at your application, then Akita will not be able to see the unencrypted version of your data. You could reconfigure your deployment to permit Akita to see the unencrypted data by adding a reverse proxy to serve as the HTTPS endpoint.
See Reverse Proxy for instructions on setting up NGINX, a popular open-source web server, as a reverse proxy. This reverse proxy can be set up as part of your container image, or run as a sidecar.
The reverse proxy, when configured with your certificate, will accept the HTTPS connection from clients, decrypt the data, and then send the unencrypted data to your application. The unencrypted data can be observed by the Akita agent on the local network. The easiest way to get started with this configuration is to have both NGINX and Akita configured as sidecars to your application container.
We also offer a NGINX Plugin.
Use HTTP from the Load Balancer instead of HTTPS
If you are using a load balancer, and your security policy permits it, you could have the load balancer terminate HTTPS, and communicate to the application via unencrypted HTTP. Amazon’s Application Load Balancer supports using either HTTP or HTTPS as a target, but only HTTP will be visible to the Akita agent.
Chrome Extension
If you have created an account and run the Chrome Extension: OpenAPI Spec Generator but only see a message to "Sit tight," then you may have hit a known bug.
Please log out of the Akita app, refresh your page, and log back in. You should see your traffic and Chrome Extension project.
Updated almost 3 years ago