Plug-and-Play Metrics & Errors
One of the main reasons to use Akita is to get plug-and-play metrics and errors across all of your endpoints.
You can get to the Metrics and Errors page by clicking on "Metrics & Errors" in the top navigation or by clicking the arrow from Errors or Latencies on the Overview page.
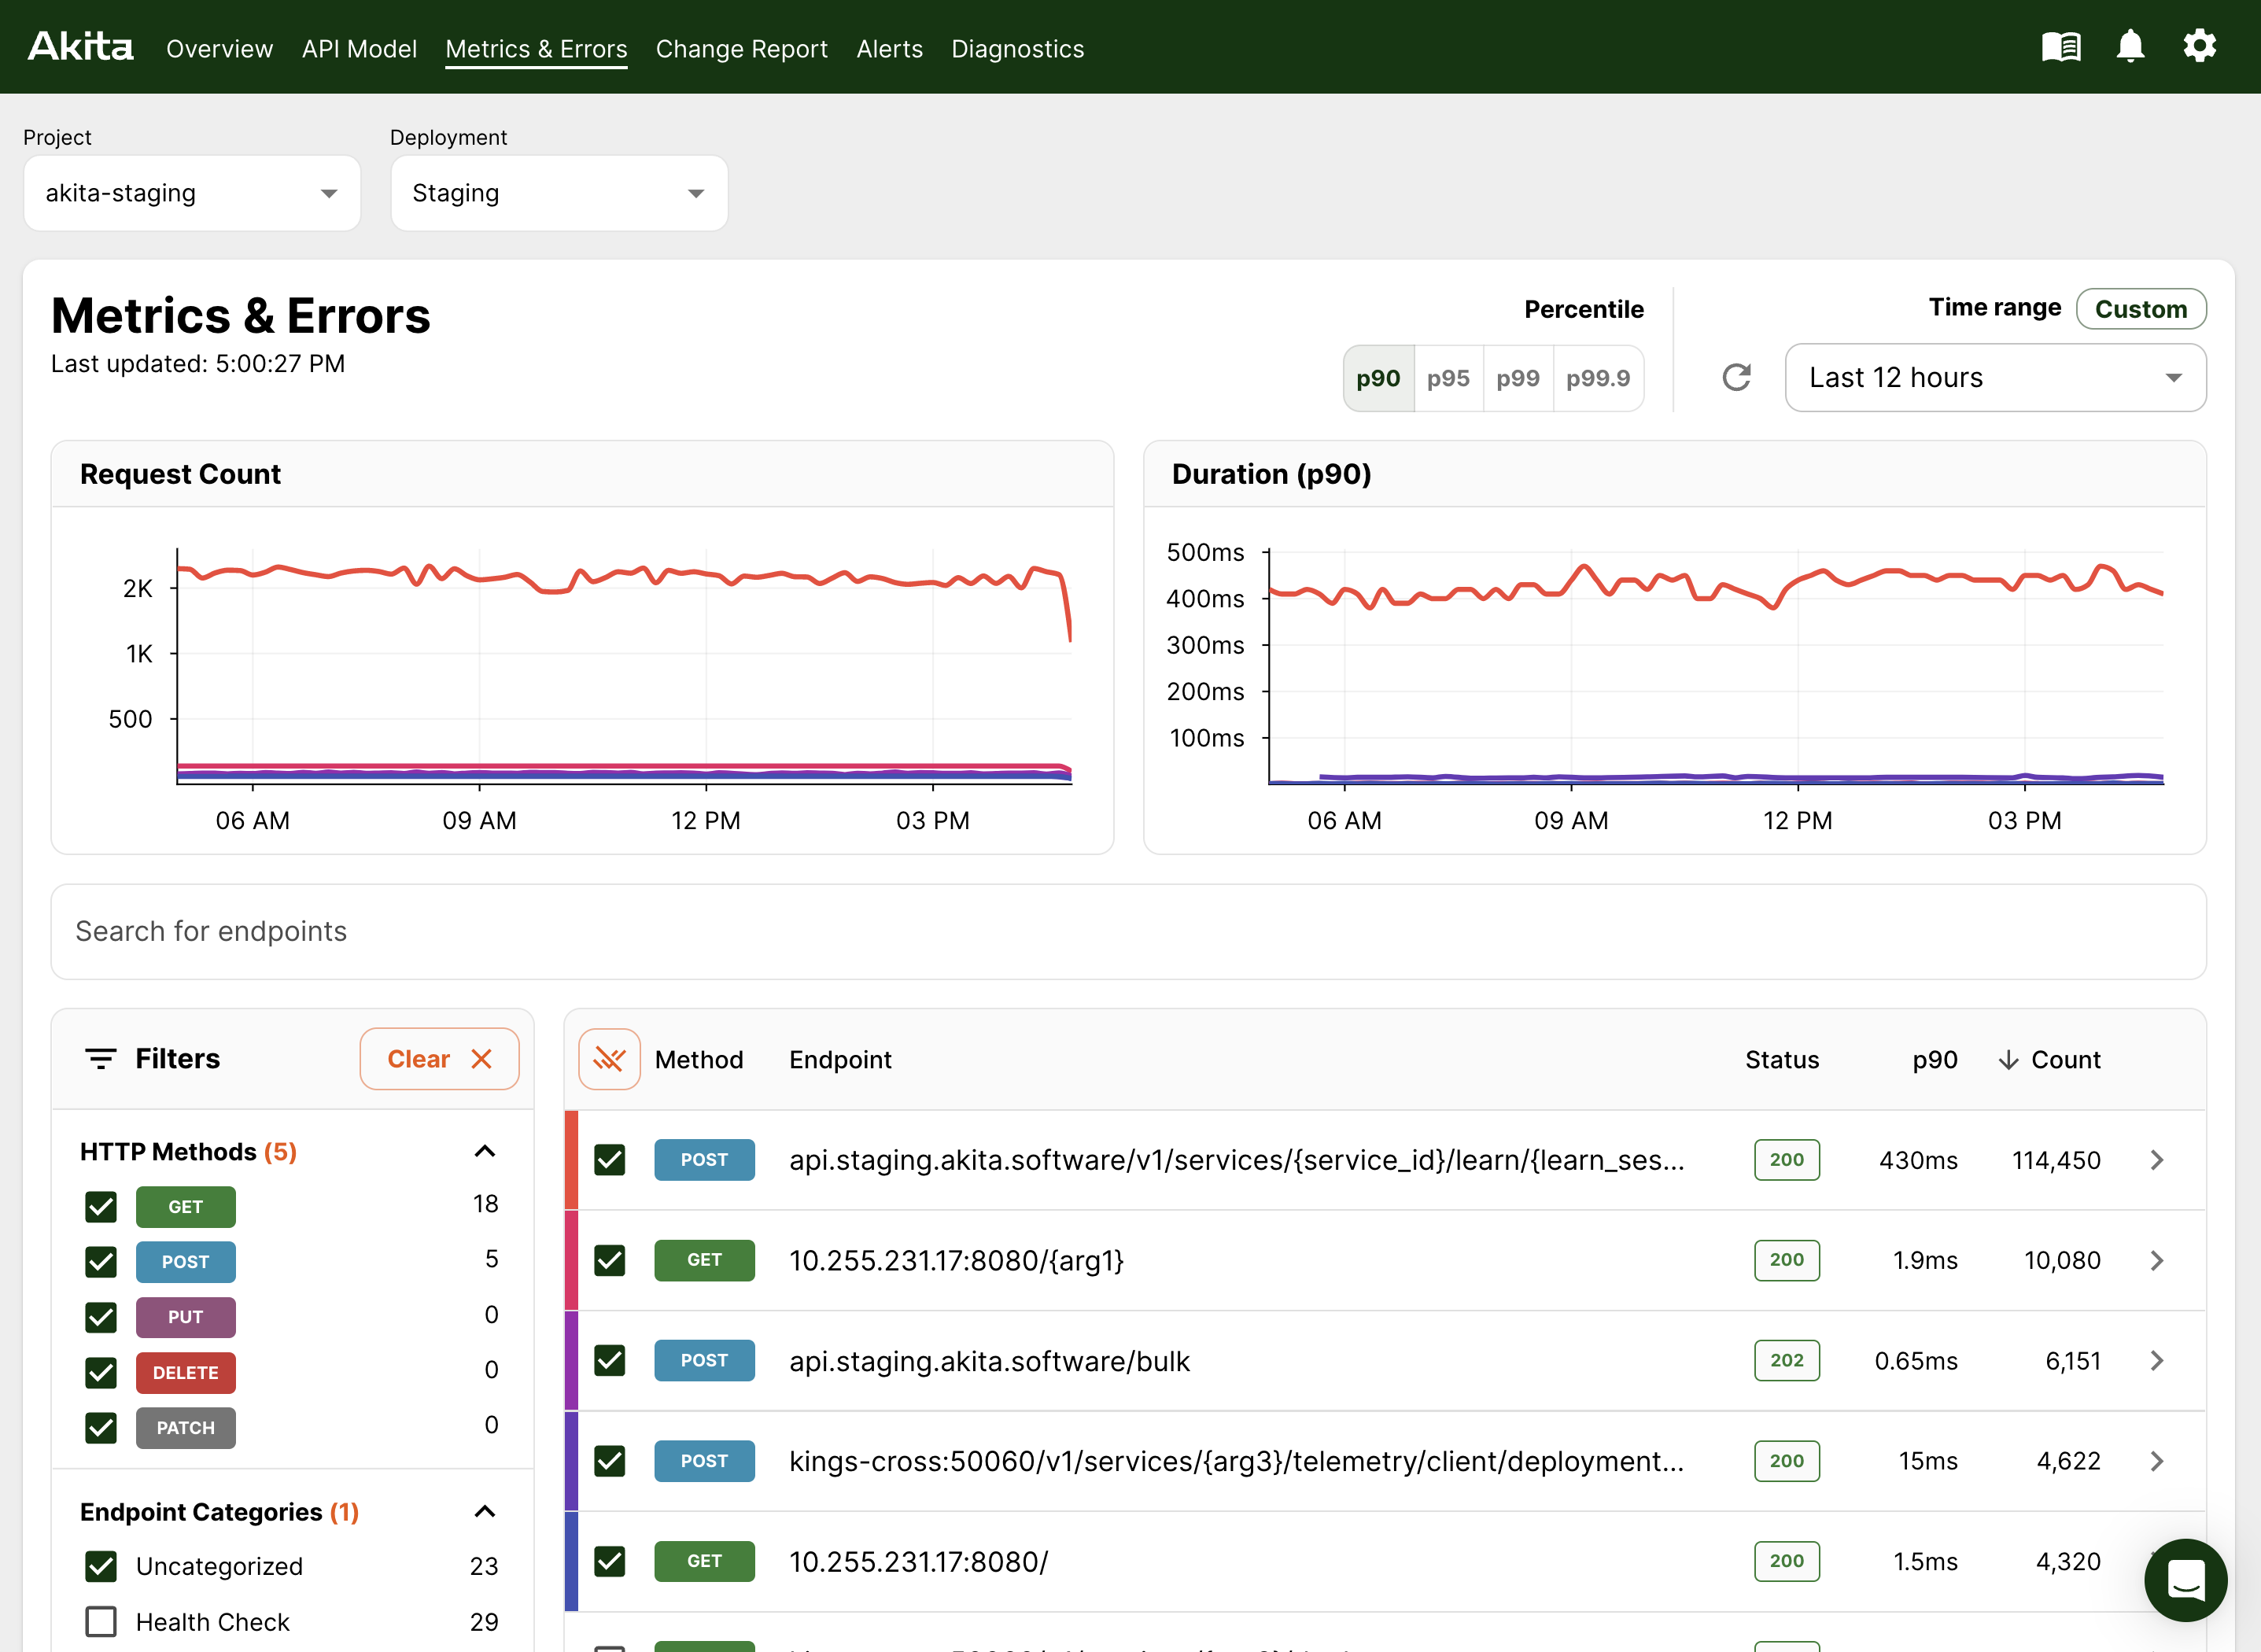
On this page, we'll show you how to:
- Investigate High Latency
- Investigate Errors
- Search and Filter Across Endpoints
- Dig Into Endpoint Details
Investigate Latencies
To see your slowest endpoints, sort endpoints by performance by clicking on the "p..." link. Double-click to reverse the order of sorting.
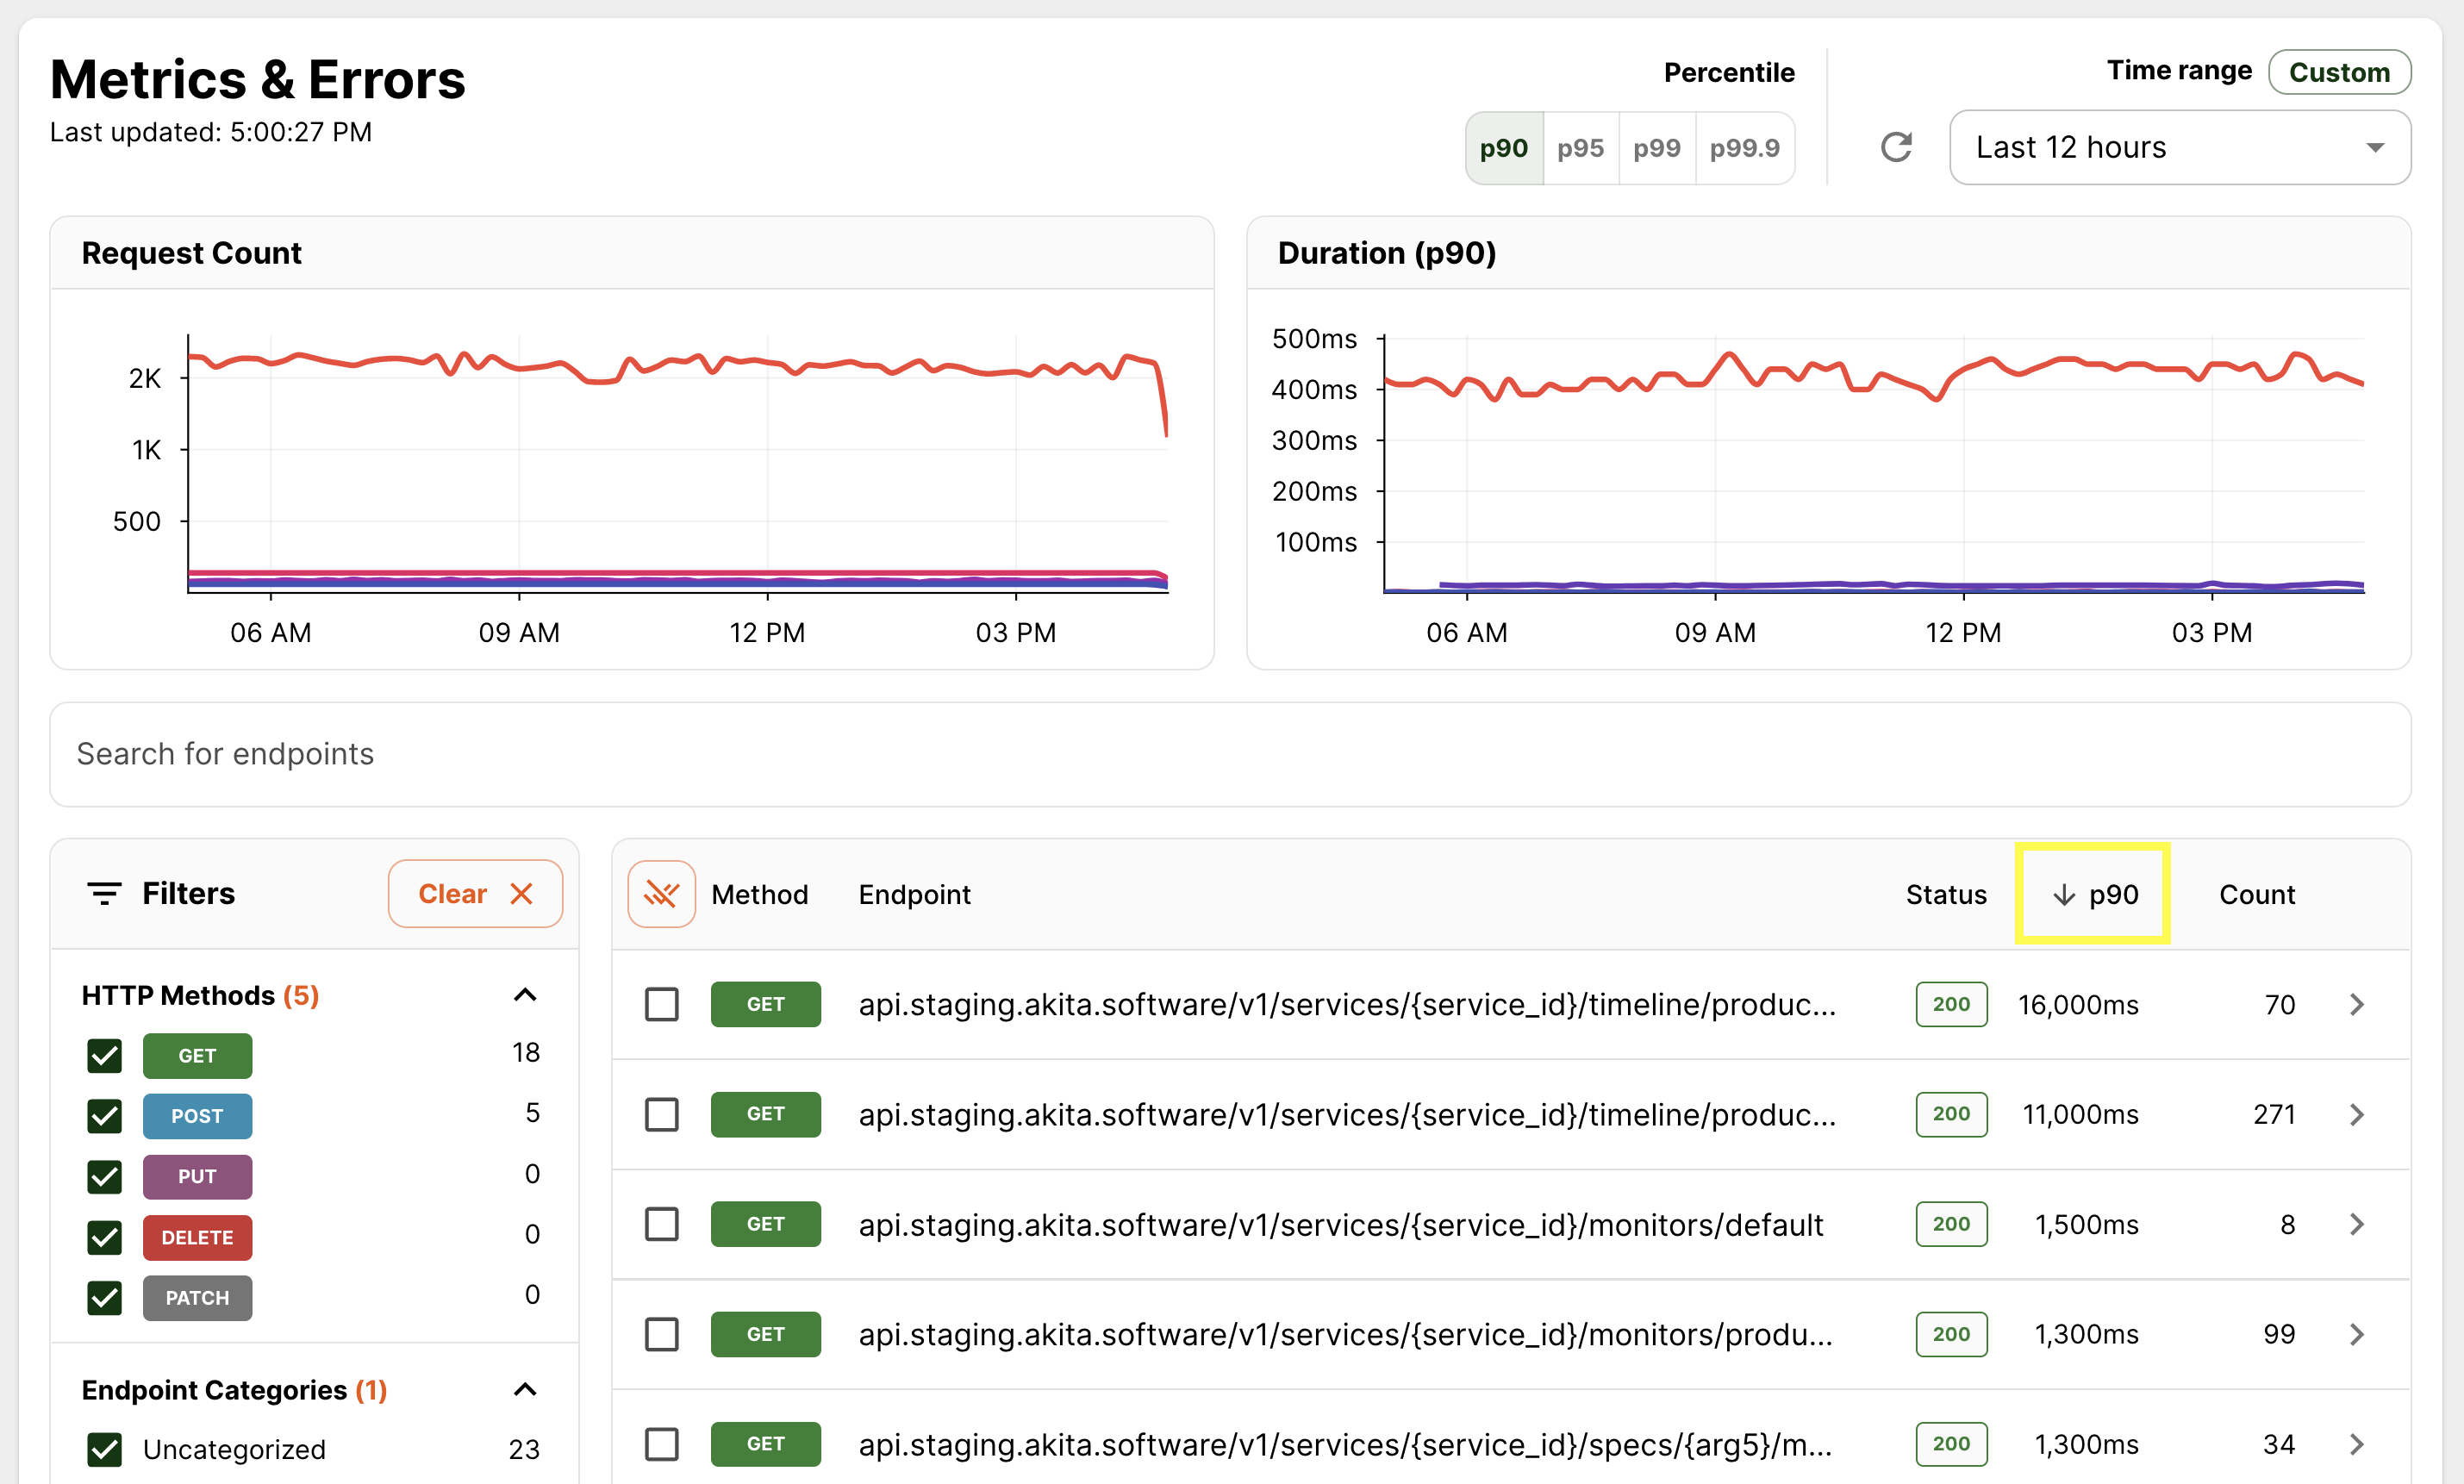
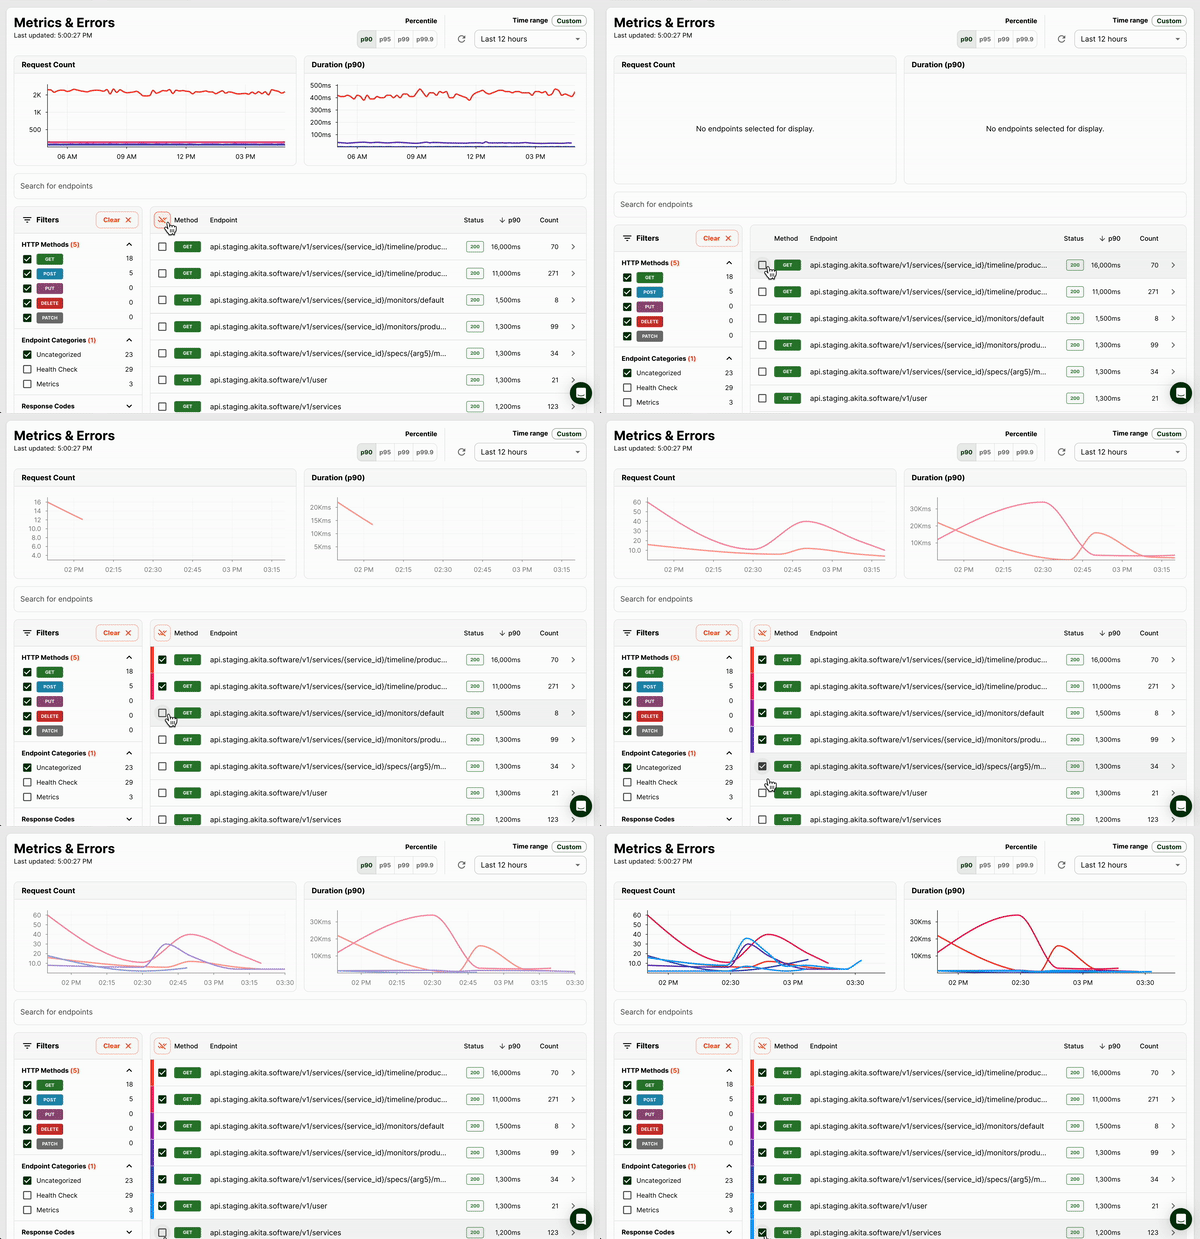
To see the slowest endpoints in the graph, de-select the current endpoints and select the endpoints you want to see.

To look at slow endpoints across different latency metrics, explore the "Percentile" toggles.

Investigate Errors
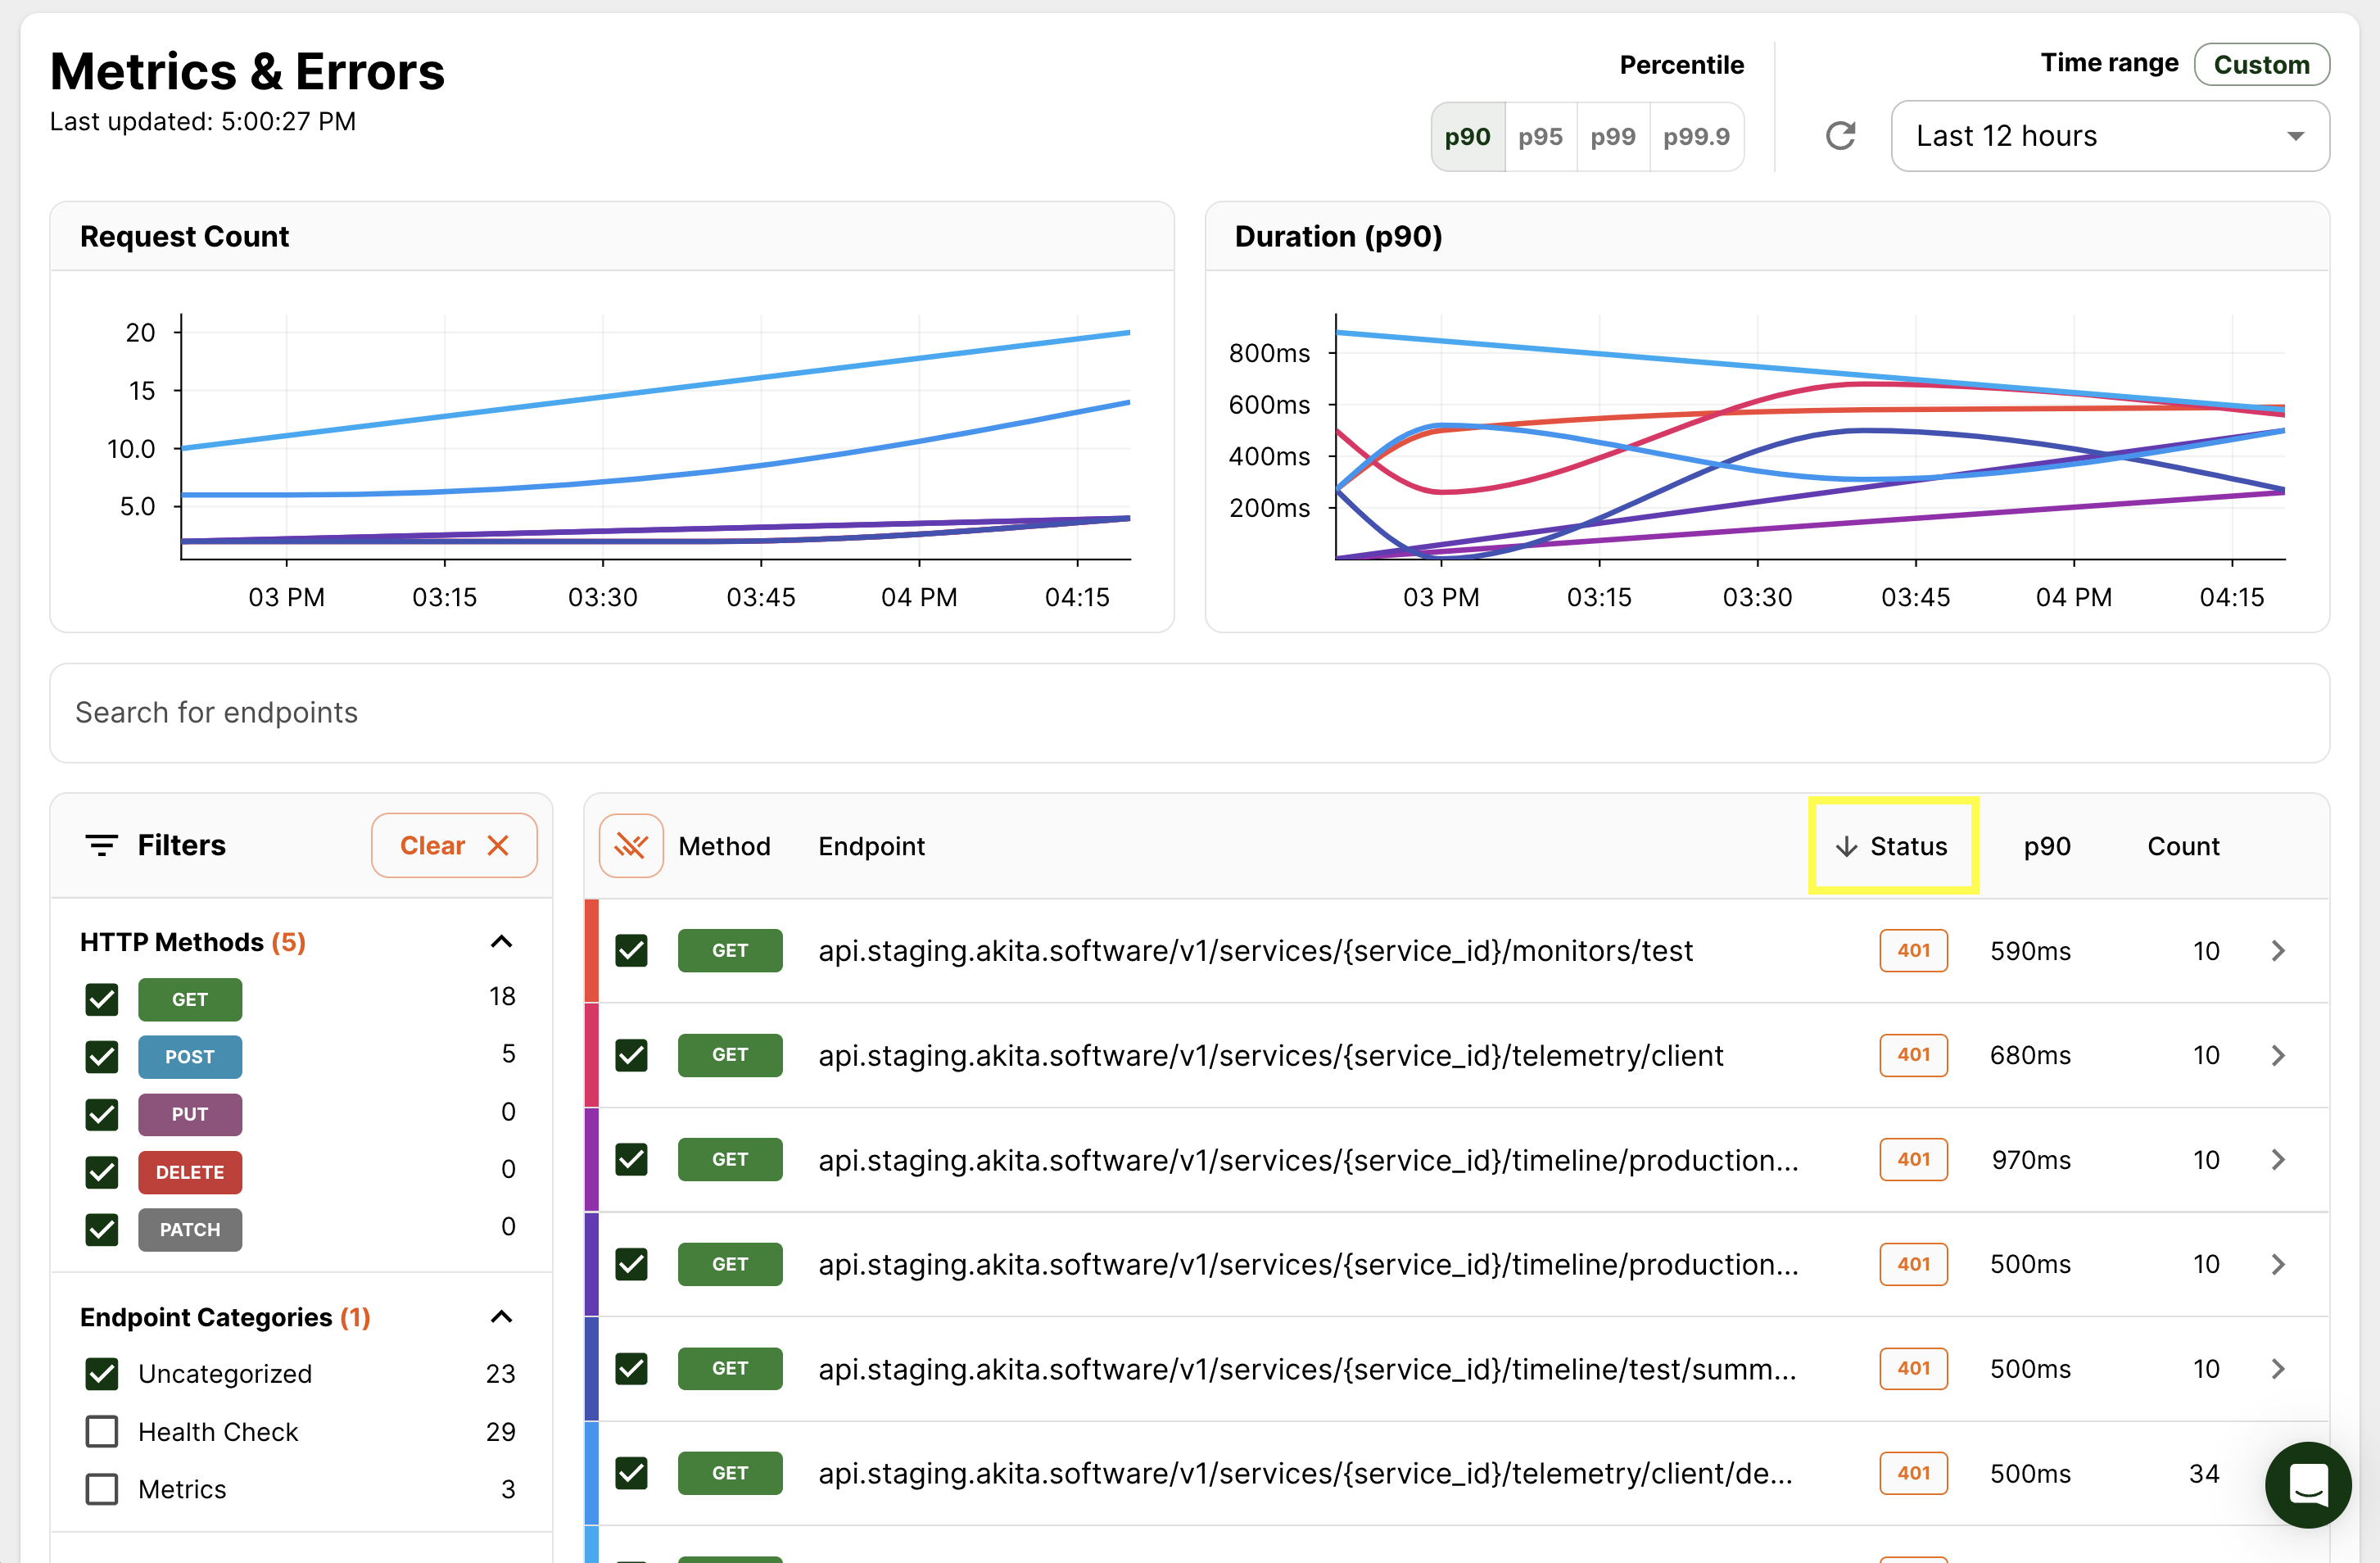
One way to investigate errors is to sort by error code to see endpoints with errors.
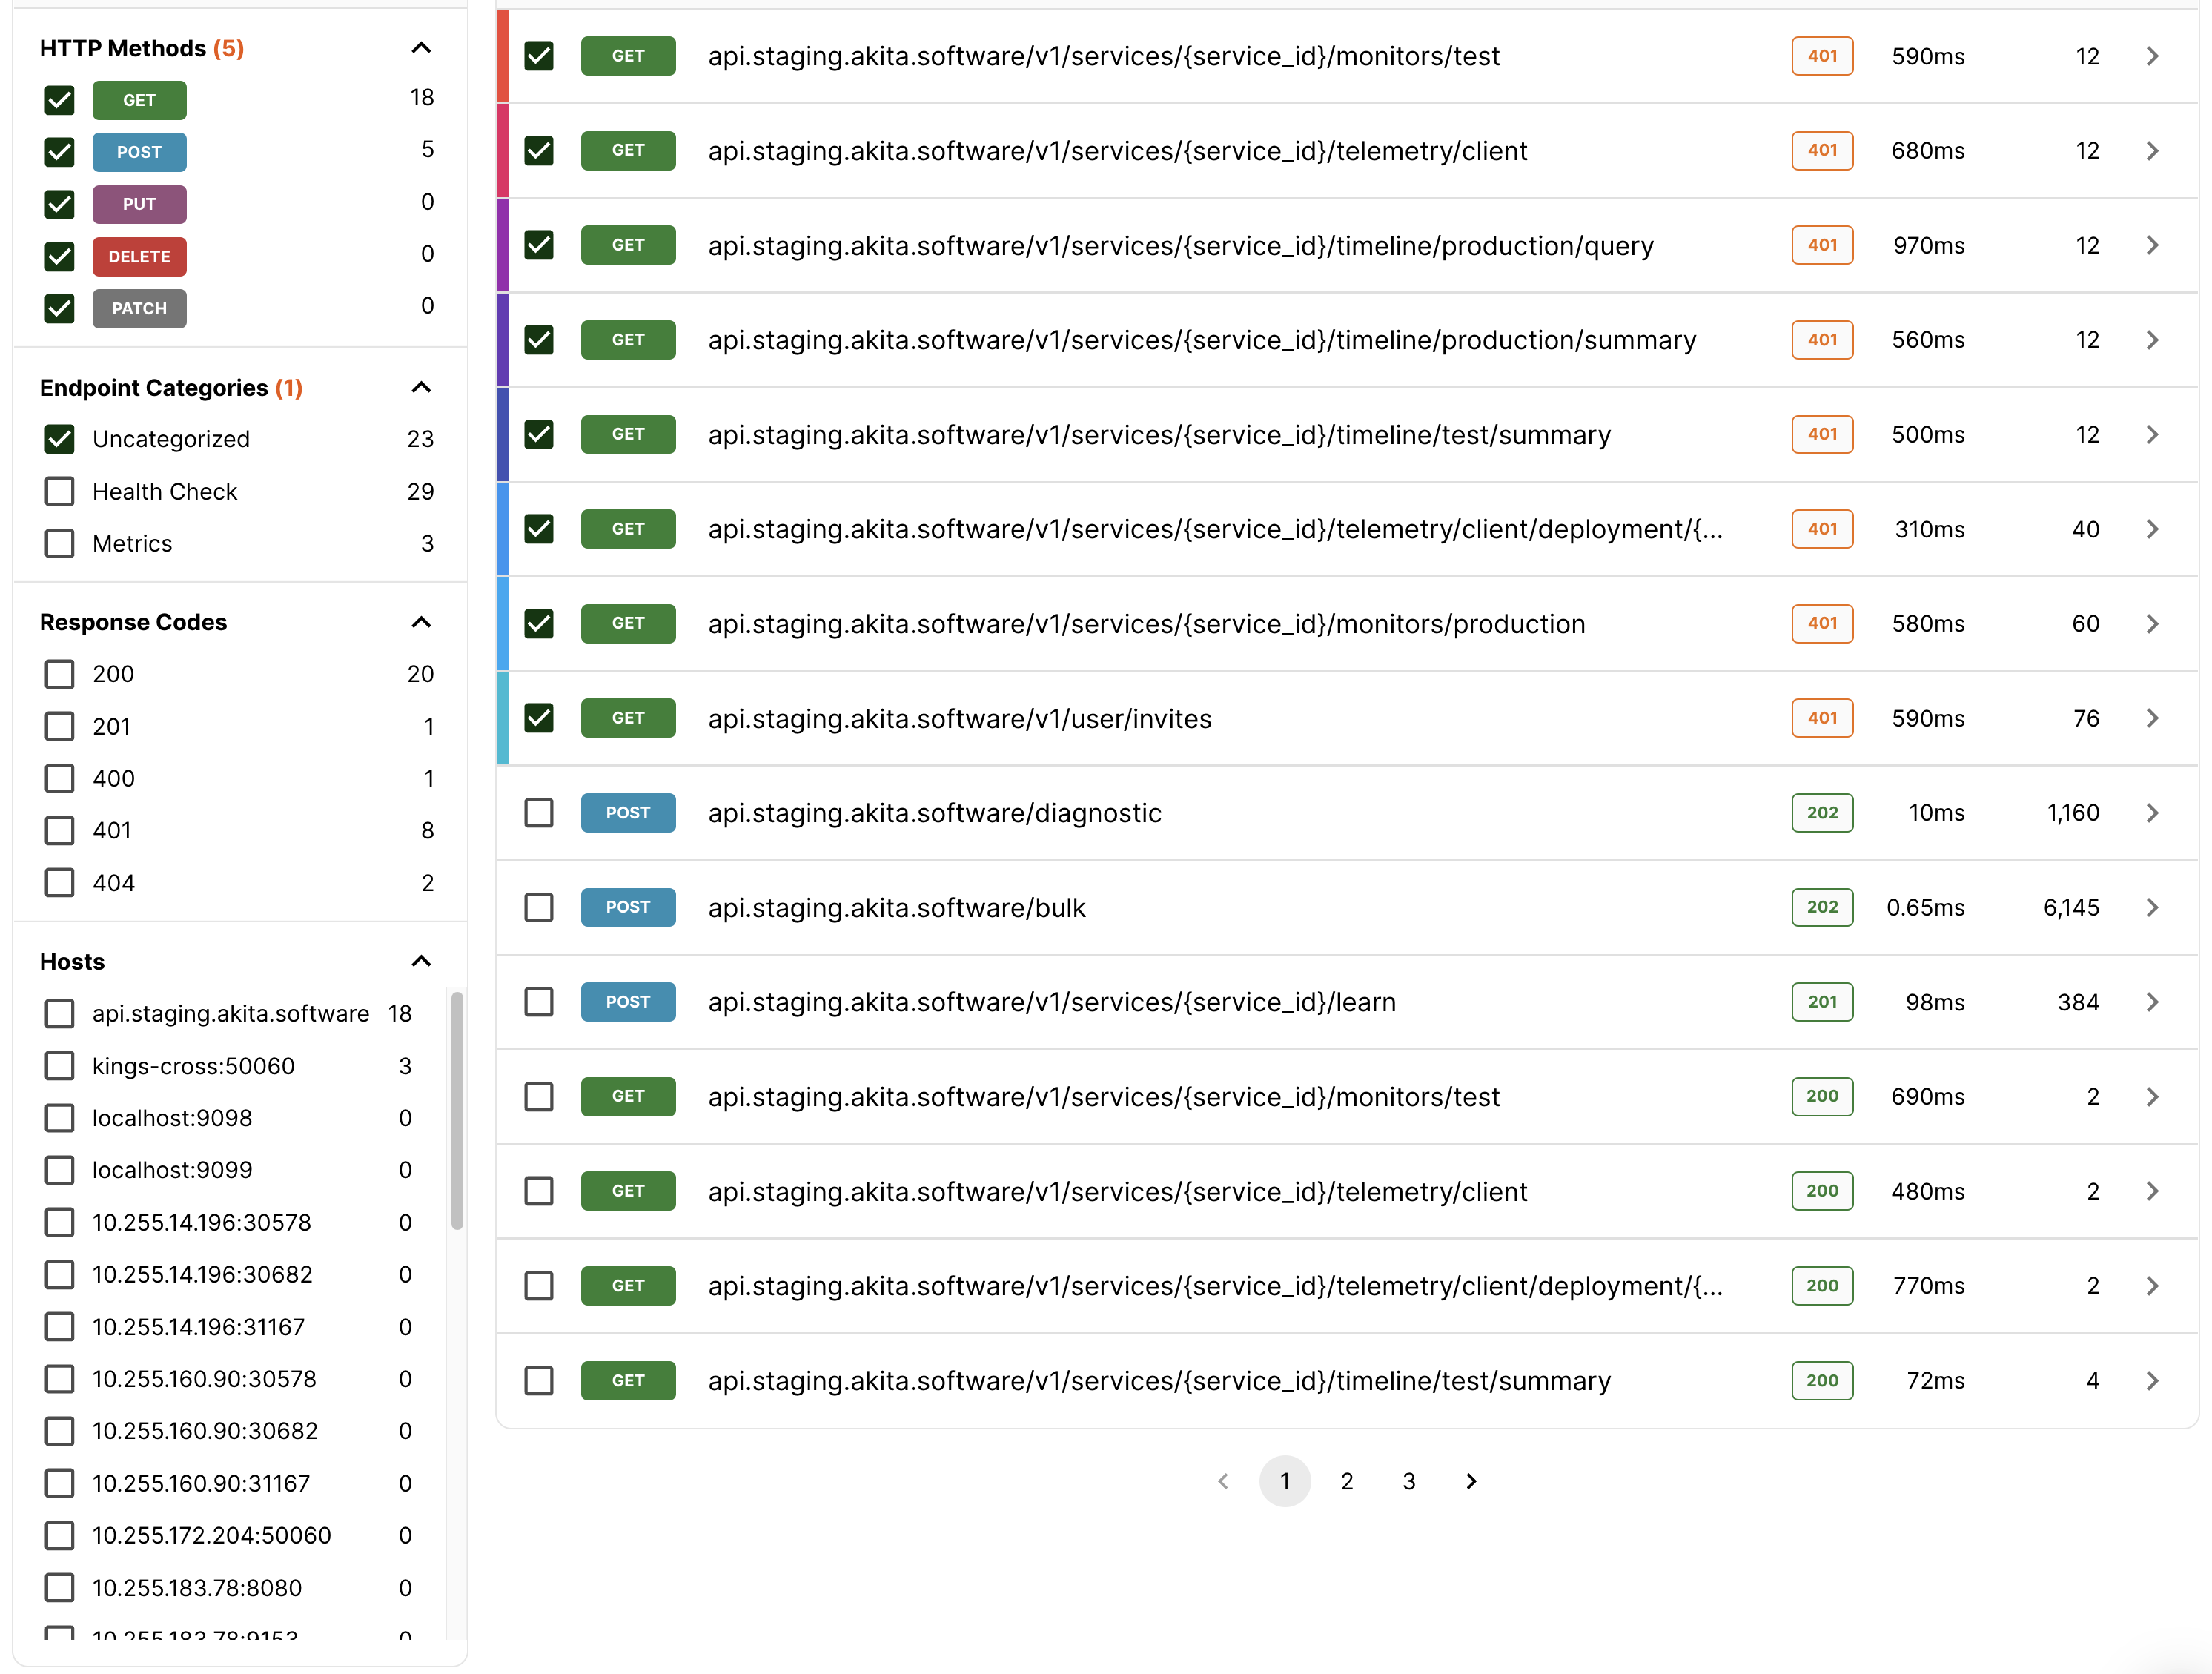
You can also select the error codes you care about in the "Response Codes" filters on the left
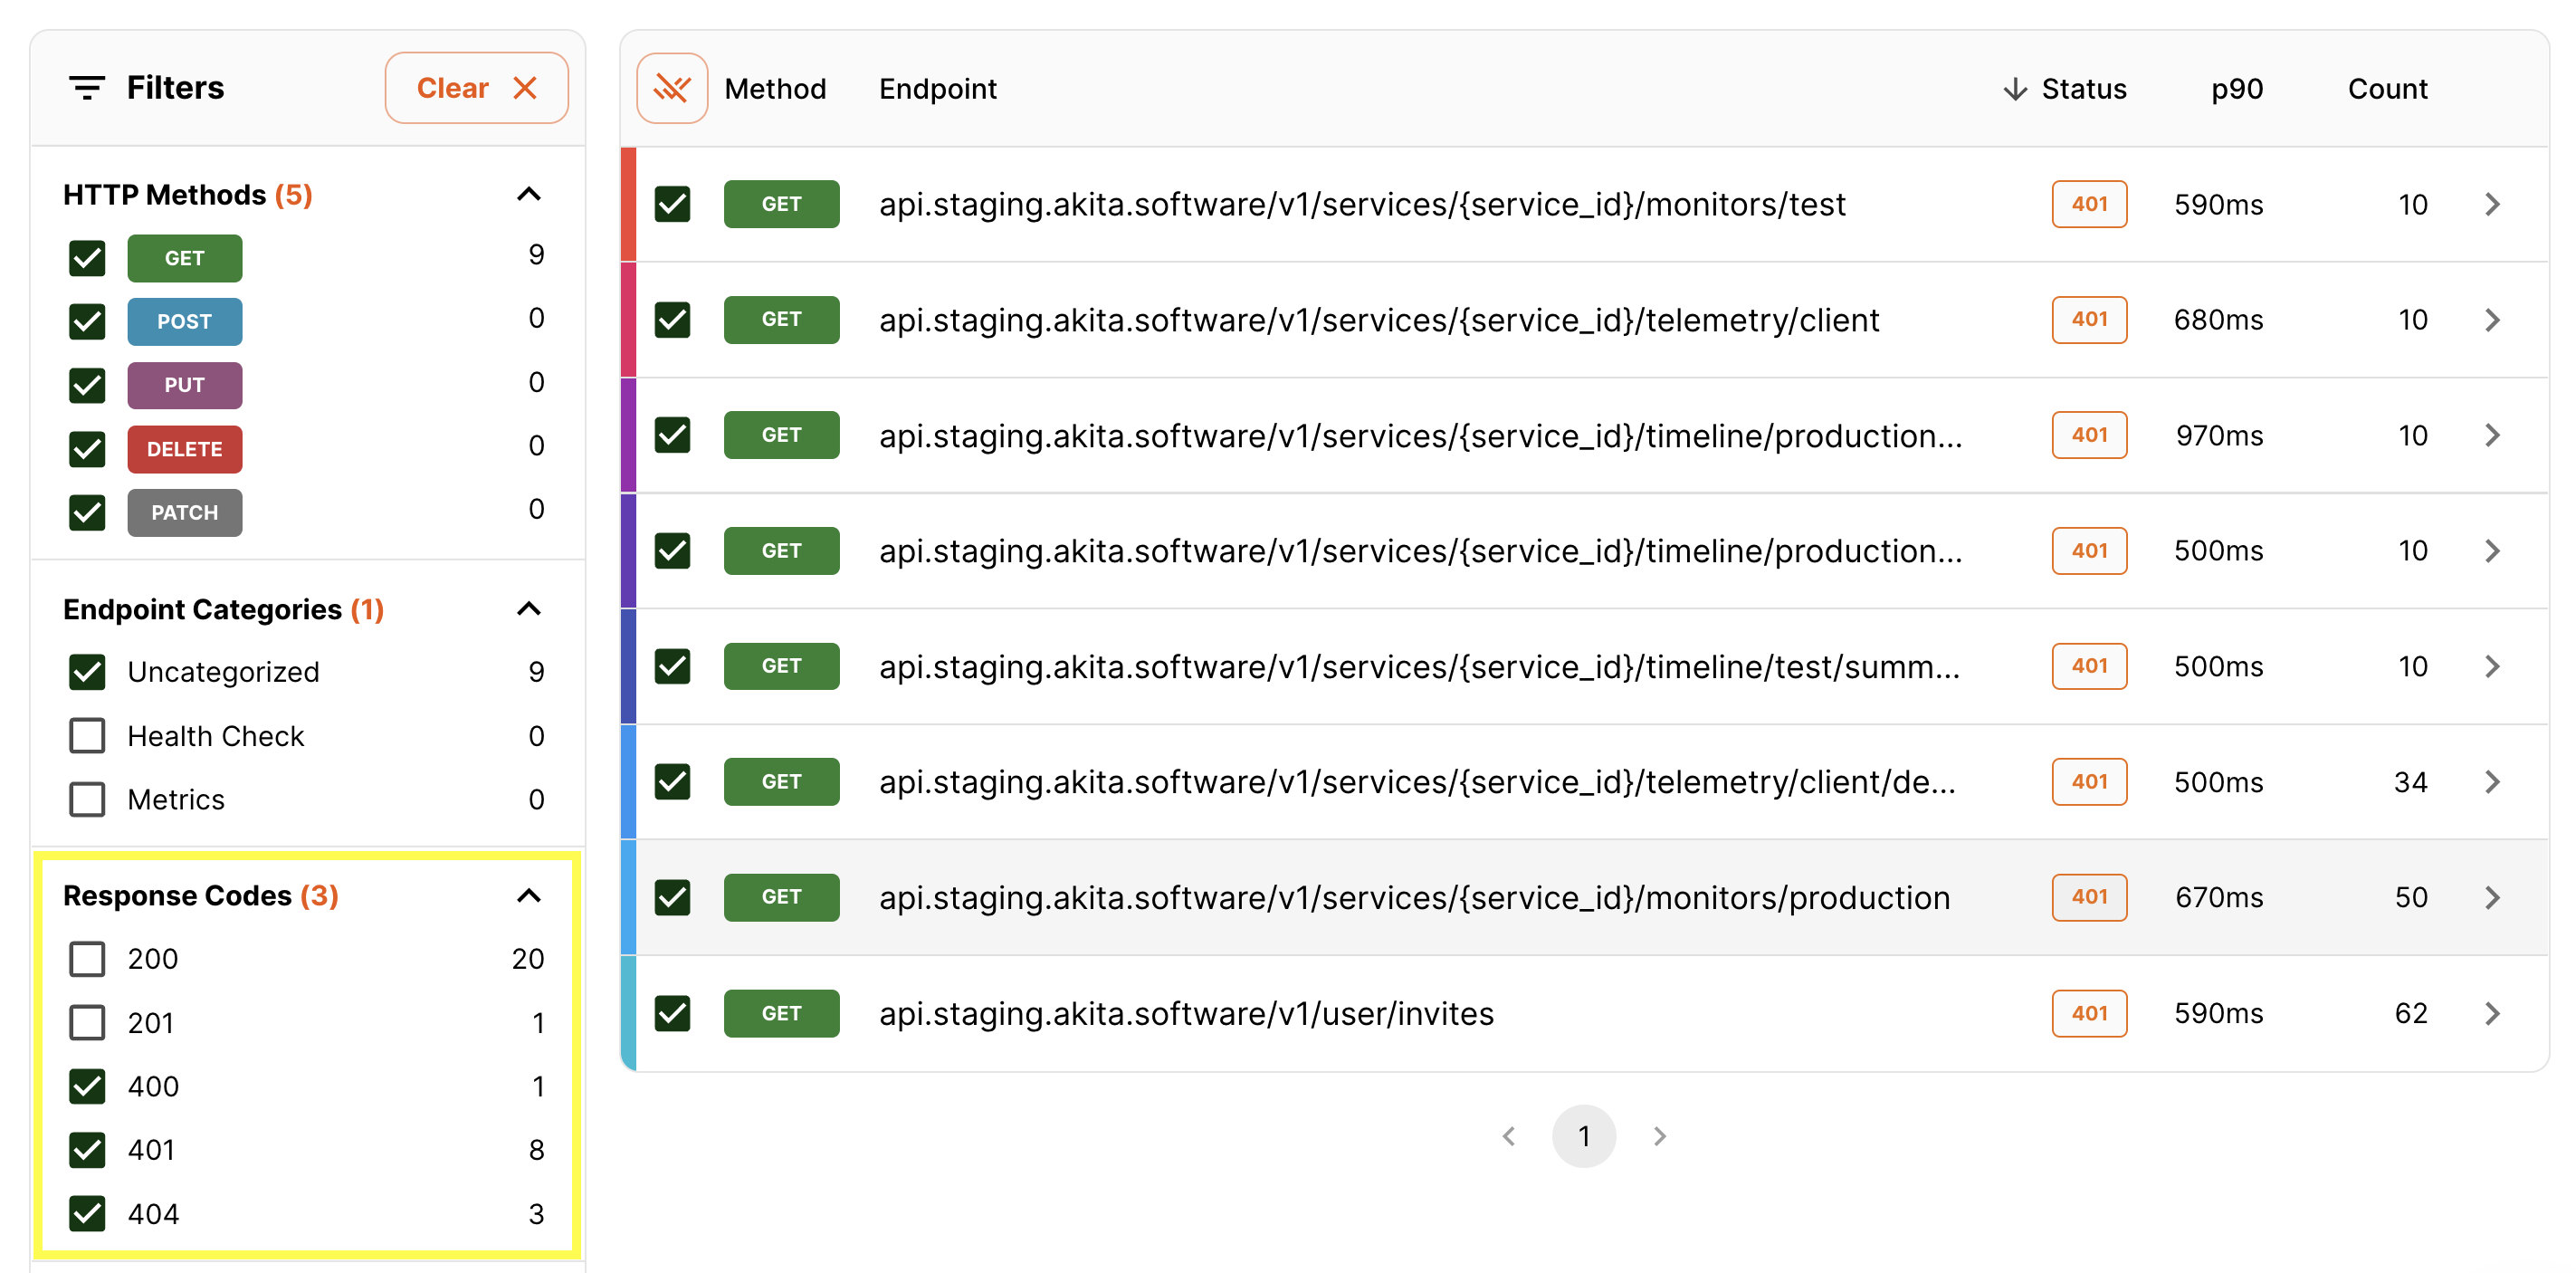
Make sure to reflect the selection in the graph:
Search and Filter across Endpoints
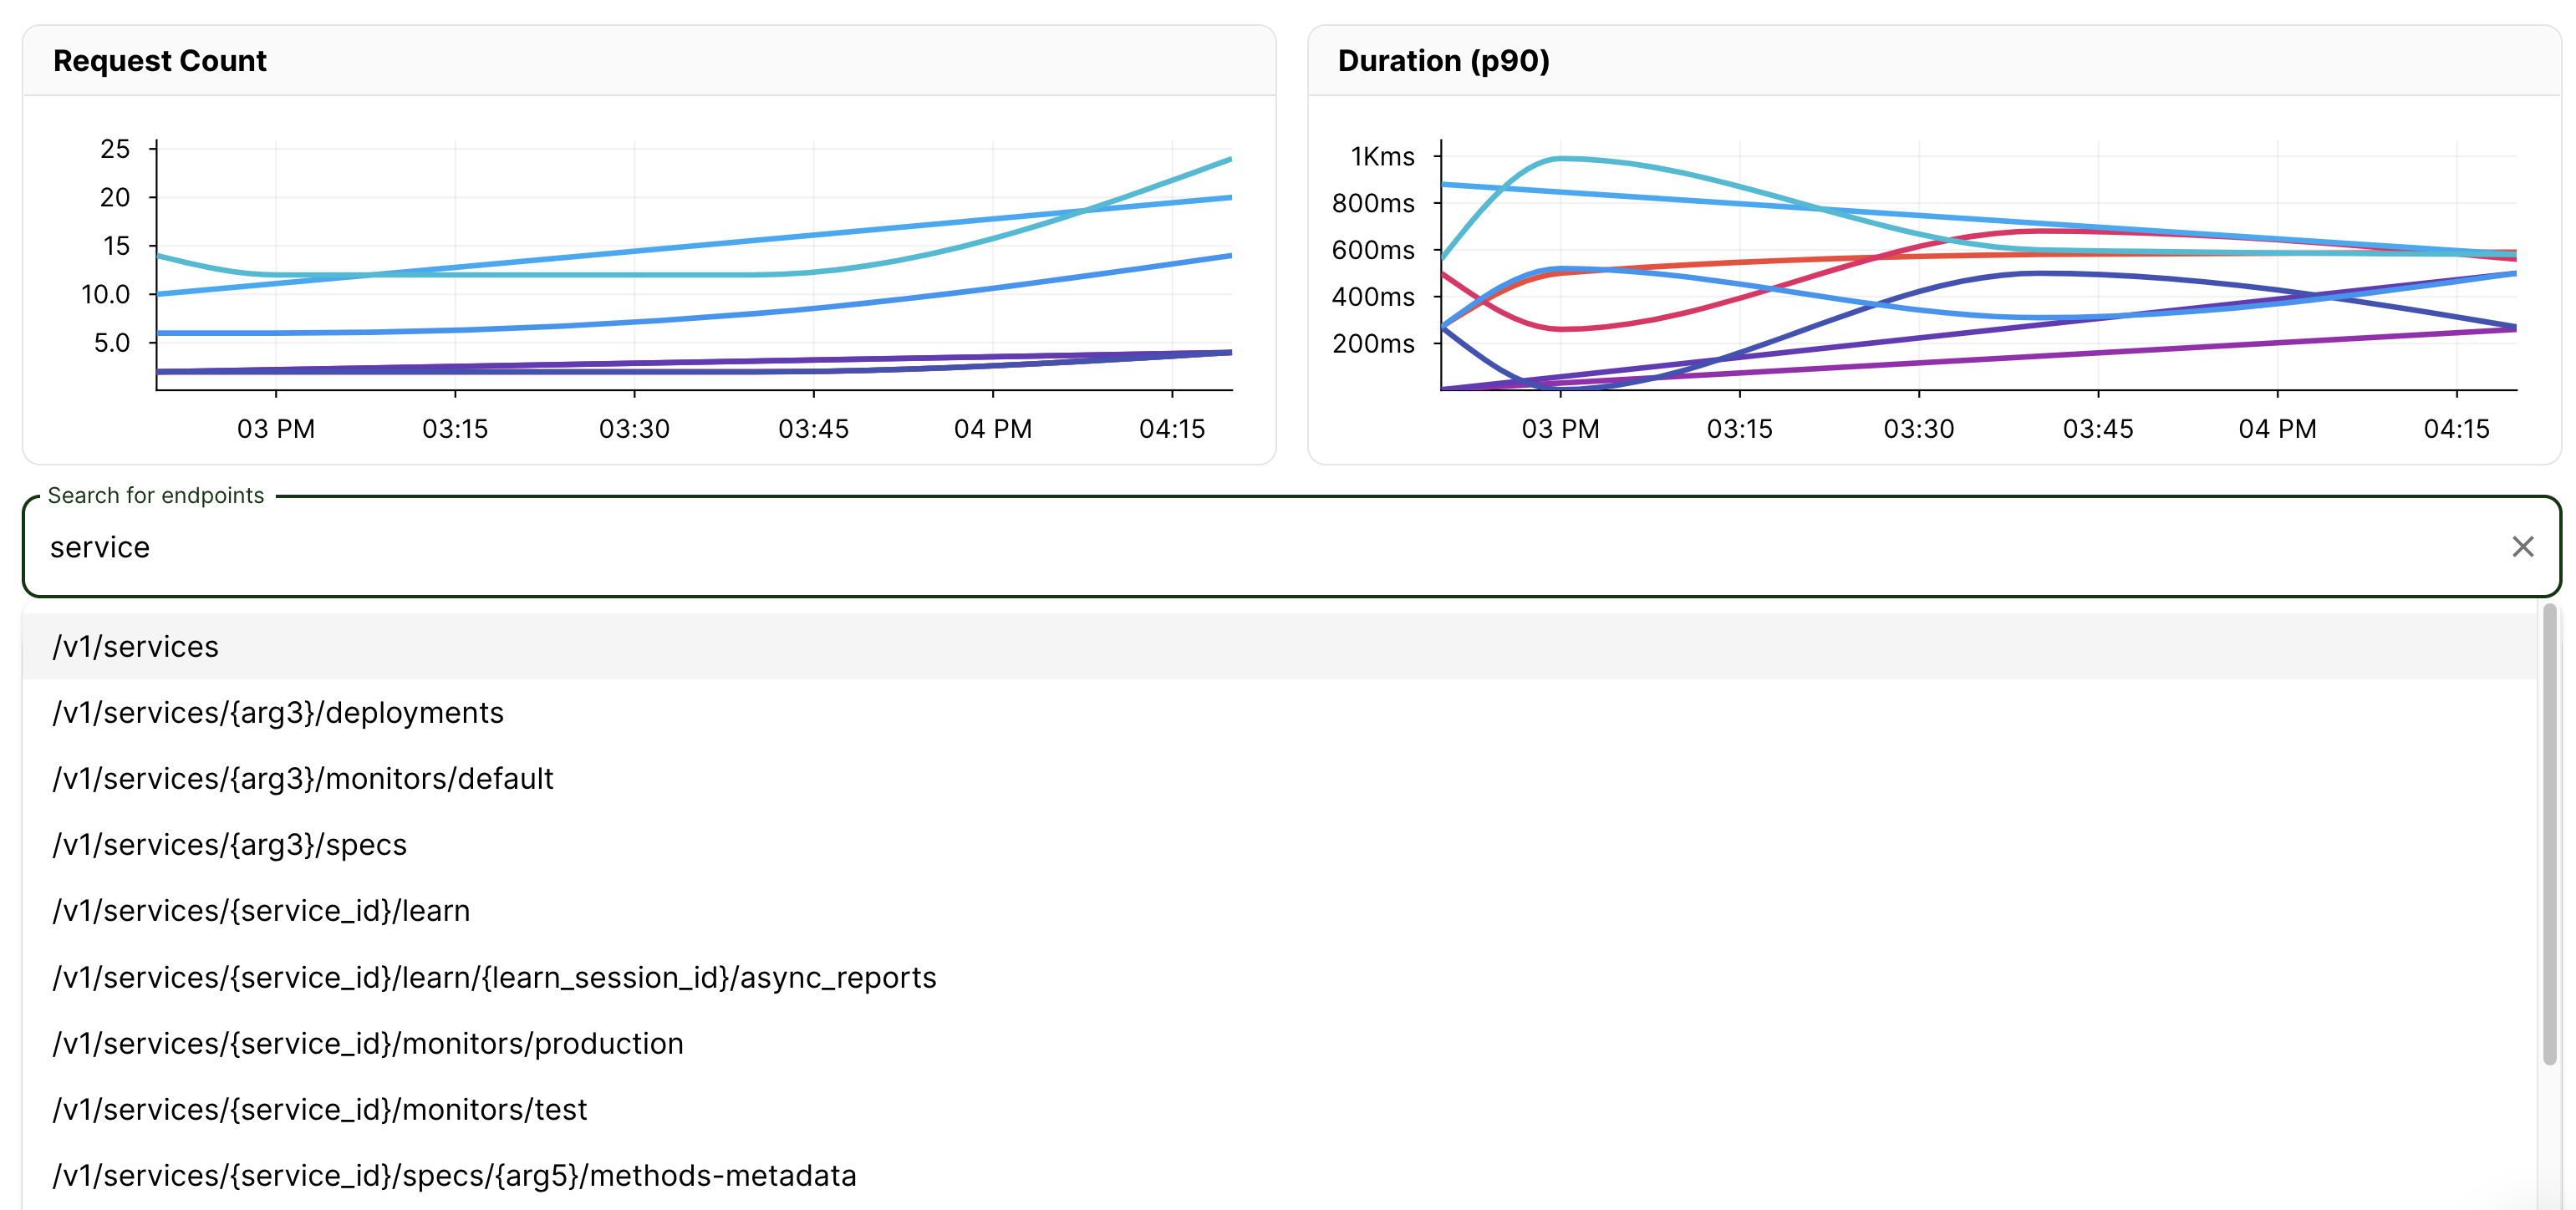
You can create specialized views over your graphs by searching and filtering across your endpoints.
The search box is under the graphs:
We also provide build-in filters of HTTP methods, endpoint categories (to help filter out health checks), response codes, and hosts.
Dig into Endpoint Details
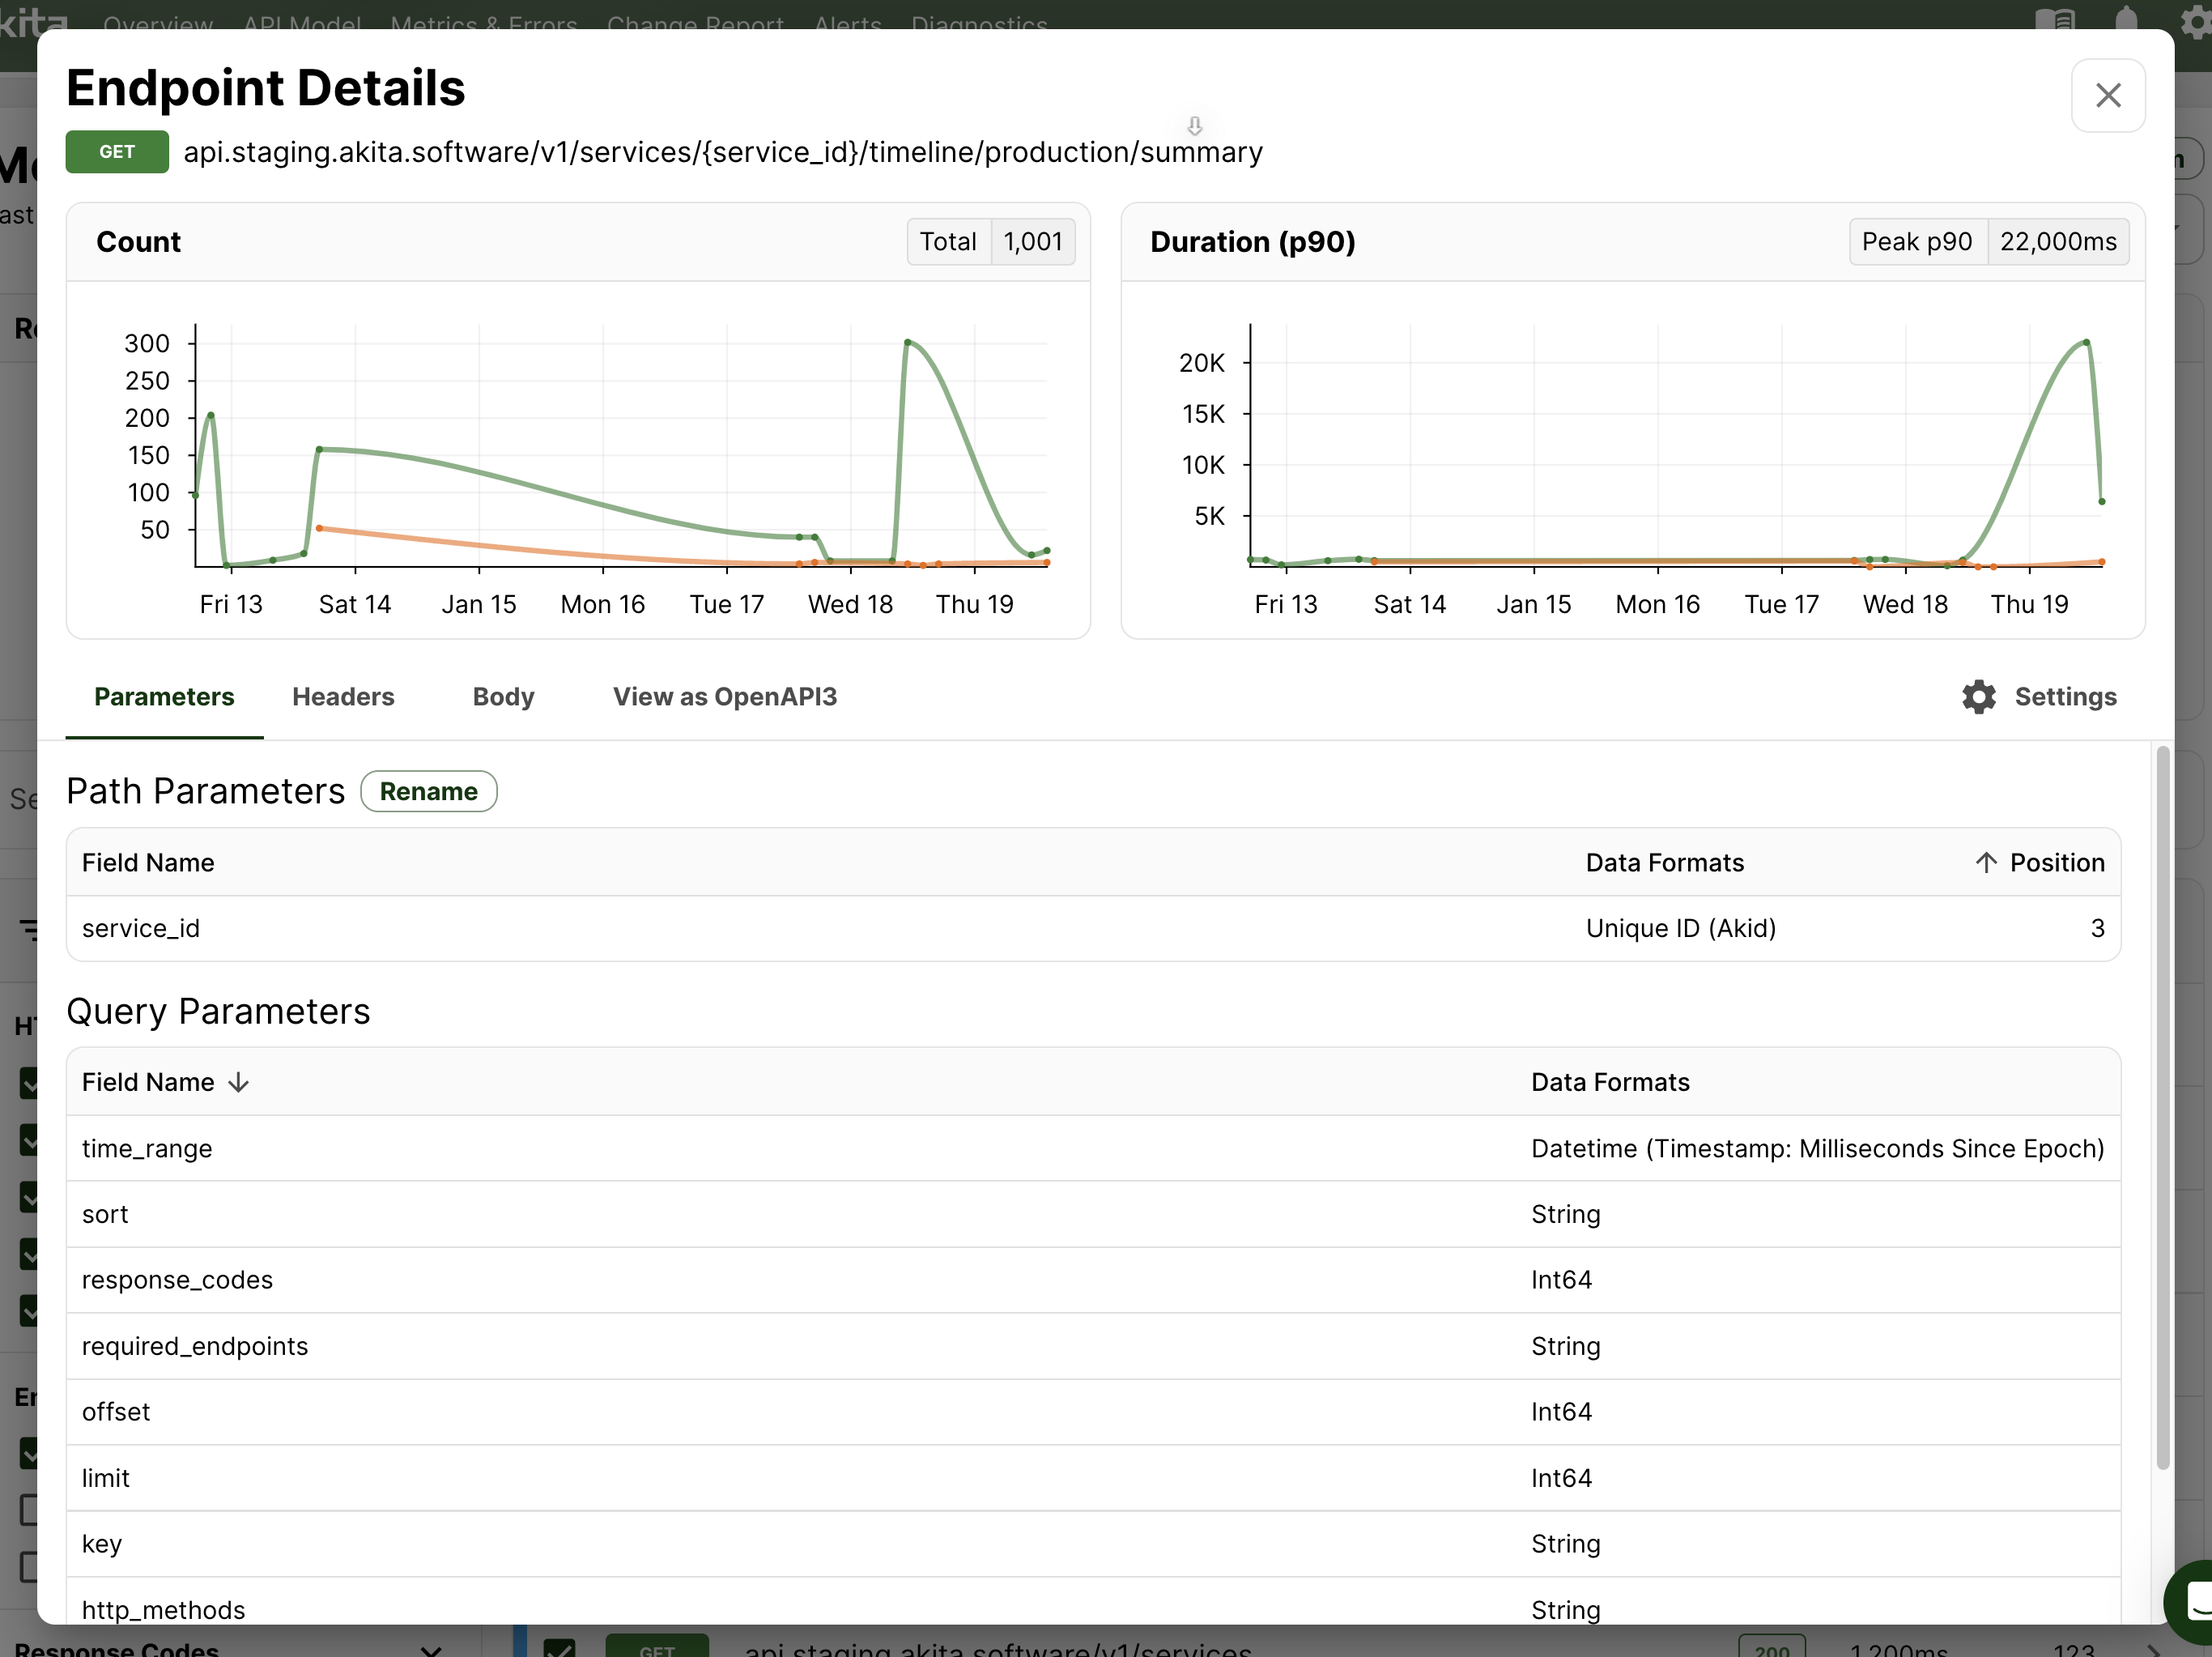
To get more information about any endpoint, click the right arrow next to the endpoint to dig in.
Updated almost 3 years ago