Deprecated page
This page is deprecated. We provide no guarantees that these instructions are up to date with the latest version of Akita. Please visit this page instead for Docker instructions.
This page will walk you through various options for integrating the Akita Agent with various Docker setups.
Trying us out locally?
If you are just getting started and testing out locally, try our in-app getting started page.
Just getting started?
If you are looking to install the Akita Agent on a single staging or production Docker container that has access to the public internet, see our [Docker Docker Getting Startedpage.
Windows support
We do not yet have official Windows support for the Akita CLI. While our users have gotten Akita to work as a container within the Windows Subsystem for Linux (WSL), it does not currently work to trace Windows APIs from a Docker container in WSL.
Below you will find instructions for:
- Attaching the Akita Agent to a container in Docker Compose
- Attaching the Akita Agent to the Docker host network
- Using the Akita Agent as a wrapper for your server process
- Running the Akita Agent on an internal network
- Providing Akita credentials in a volume
This guide assumes that you:
- Are in the Akita beta
- Have set up an Akita account
- Have created a project
- Have generated an API key ID and secret
Docker Compose
To attach the Akita Agent to your Docker container, your container must a.) be connected to the public internet, and b.) be running. Then:
- Start your service via
docker-compose. - Locate the name of the container where the app, service, or API you want to monitor is running.
- Add the following to your Docker Compose file, specifying the
docker-composeservice label in thenetwork_mode:
version'3'
services:
  your-service-label:
    ...
  akita:
    container_name: akita
    image: akitasoftware/cli:latest
    environment:
     - AKITA_API_KEY_ID=apk_xxxxxxxx
     - AKITA_API_KEY_SECRET=xxxxxxx
    network_mode: "service:your-service-label"
    entrypoint: /akita apidump --service your-project-name
Then verify that the Akita Agent is running by going to the Akita web console and checking out the incoming data on the Model page. You should see a map of your API being generated as the Akita Agent gathers data.
Host network
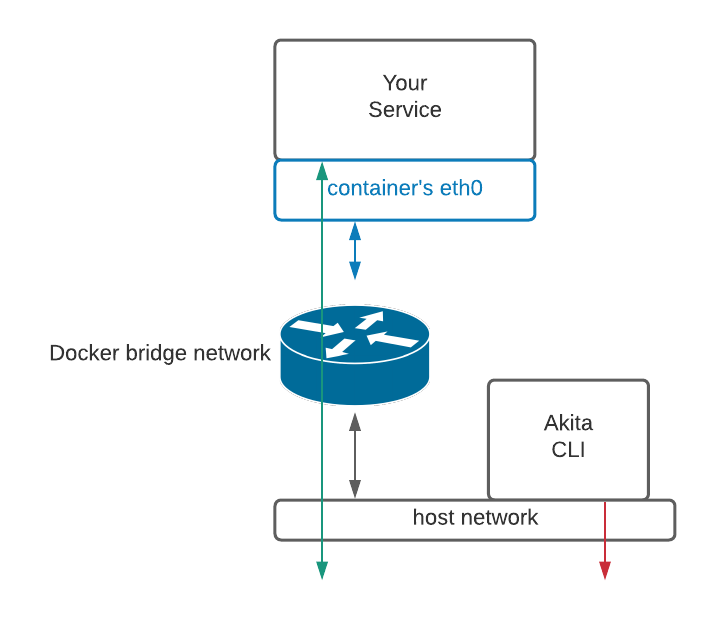
To monitor multiple containers simultaneously, or to monitor a container on an internal network, attach the Akita Agent to the host network.
Linux-only
Host mode is only available for Linux-based Docker.
There are two options for attaching the Agent:
Then verify that the Agent is attached.
Docker run
To attach the Akita Agent to the host network, run the following command using the port number from inside your service’s container:
docker run --rm --network host \
  -e AKITA_API_KEY_ID=... \
  -e AKITA_API_KEY_SECRET=... \
  akitasoftware/cli:latest apidump \
  --project your-project-name
  --filter "port 80"
Because you are using the port number from inside your service’s container, Akita's packet capture sees the untranslated port instead of the externally-visible port number. This allows Akita to capture any container's external network traffic, and even traffic on internal networks.
Docker compose
To attach the Akita Agent to the host network, specify network_mode: “host” in the YAML definition as shown below:
version'3'
services:
  ...
  akita:
    container_name: akita
    image: akitasoftware/cli:0.17.0
    environment:
     - AKITA_API_KEY_ID=apk_xxxxxxxx
     - AKITA_API_KEY_SECRET=xxxxxxx
    network_mode: "host"
    entrypoint: /akita apidump --project your-project-name
Verify
In the Akita web console, check out the incoming data on the Model page. You should see a map of your API being generated as the Akita Agent gathers data.
Then check out the Metrics and Errors page to get real-time information on the health of your app or service.
If everything has been set up successfully, your Akita deployment will look like this:

Server process wrapper
The Akita agent can start a child process while collecting data. You can use this feature to change the entry point of your container to the Akita Agent, which will allow Akita to start your main server process and capture the data for the entire lifetime of that server process.
You can also separate different deployments.
To use the Akita Agent to capture data this way, add the following to your Dockerfile:
...
ENTRYPOINT ["/usr/local/bin/akita", "apidump",
            "-c", "normal server command line here",
            "-u", "root", "--project", "your project name" ]
This will install the Akita Agent binary in your container at build time, for example in its usual location at /usr/local/bin/akita. And it will change the entry point of the container to call the akita apidump command, with the normal server command line specified using the -c option.
Separate deployments
If you want to split the models you've created based on which cluster or environment they've come from, use a separate project, for example "my-service-staging" or "my-service-production".
Internal network
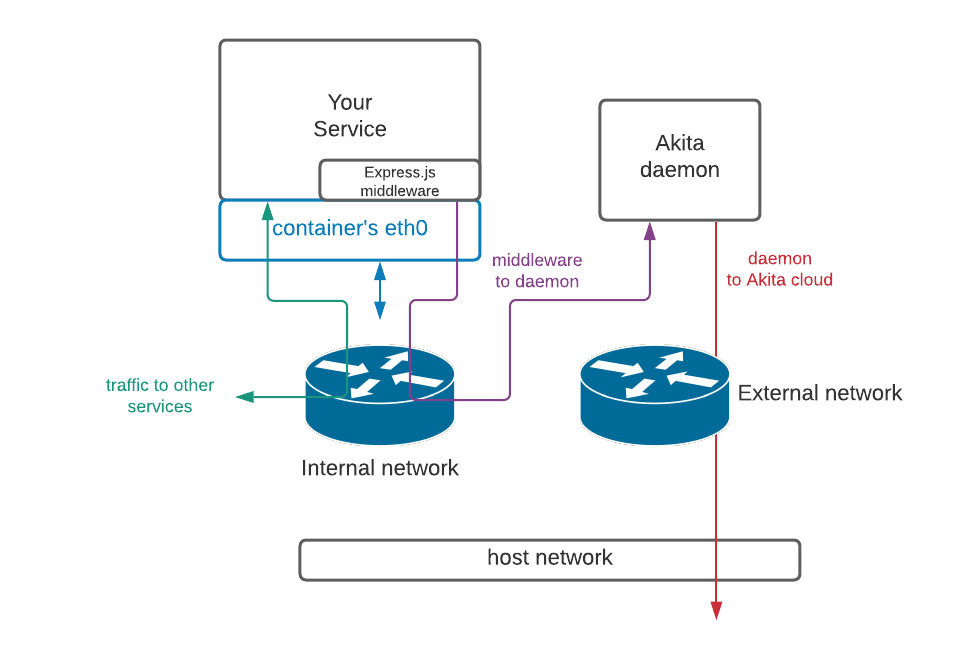
If you run the Akita Agent in daemon mode, the middleware must have access to the Akita daemon, and the Akita daemon must be able to access the Akita cloud services. Use Docker-compose to ensure that the service being monitored and the Akita Agent are connected to the same network.
If the service's network is internal, then the Akita Agent must be connected to an additional external network. To do this, create a Docker Compose file like the following:
version: '3'
services:
  test:
    container_name: test
    image: test-middleware:latest
    networks:
      - int-network

  akita_daemon:
    container_name: akita_daemon
    image: akitasoftware/cli:0.16.2
    environment:
      - AKITA_API_KEY_ID=apk_xxxxxxxx
      - AKITA_API_KEY_SECRET=xxxxxxx
    networks:
      - int-network
      - ext-network
    entrypoint: /akita --debug daemon --port 50080 --name my-daemon-name

networks:
  ext-network:
    driver: bridge
  int-network:
    driver: bridge
    internal: true
In the Express.js middleware configuration, the daemon host would be set to akita_daemon:50080. Docker's DNS setup ensures that the correct IP address is used. The result will resemble the following:

Volume credentials
Many of the examples above specify the Akita credentials for the container on the command line or as environment variables, which can be insecure. A better approach is to mount the file containing your Akita credentials into the container. You can do this by using the following flag on the Docker command line:
docker run ... \
  --volume ~/.akita/credentials.yaml:/root/.akita/credentials.yaml:ro
  ...
This maps your current user's credentials.yaml file, created by akita login, into the container.
You can also use docker's --env-file argument to specify environment variables in a file instead of on the command line.