Docker
Deprecated Page
This page is deprecated. We provide no guarantees that these instructions are up to date with the latest version of Akita. Please visit this page instead for Docker instructions.
Getting started with Akita is as simple as dropping our Agent into your service or stack. Once we’re in, we gather all the data you need and surface it in the Akita app so you can easily see what your system is doing.
Below are instructions for installing the Akita Agent on a staging or production Docker container that has access to the public internet. You will need to be in our beta to use this.
Windows
We do not yet have official Windows support for the Akita Agent. While users have gotten Akita to work as a container within the Windows Subsystem for Linux (WSL), it does not currently work to trace Windows APIs from a Docker container in WSL.
Looking for something more advanced?
See our Docker integration reference if you are looking to:
- Attach an Akita Agent to a container in Docker Compose, the host network, or as a daemon on an internal network
- Use the Akita Agent as a wrapper for your server processes
- Mount the file containing your Akita credentials into the container
You will be setting up the Akita Agent to run within a single Docker container. To set up the Akita Agent you will:
- Create an Akita Project
- Generate an API key for the Akita Agent
- Attach the Akita Agent to a running container
Create a project
Log into the Akita App, and go to the Settings page.
Enter a project name and click "Create Project". We suggest naming the project after your app or deployment stack.

Give your project a name that's easy to remember – you'll need it later, when you start the Akita Agent on the CLI.
Generate API key
On the same Settings page, locate and click the “API Keys” tab. Click the “Set up the Akita client” button. Copy your API key secret into your favorite password manager or somewhere else you can easily access it. Also note your API key, as you will need it later.

Attach Agent
To attach the Akita Agent to your Docker container, your container must a.) be connected to the public internet, and b.) be running. Then:
- Start your service via
docker runordocker-compose. - Locate the name of the container where the app, service, or API you want to monitor is running.
- Start the Akita Agent and specify the container’s network stack with the command below, filling in the port number that your service is using inside the container (omit the filter if you want to capture both incoming and outgoing data):
docker run --rm --network container:your-container-name \
  -e AKITA_API_KEY_ID=... \
  -e AKITA_API_KEY_SECRET=... \
  akitasoftware/cli:latest apidump \
  --project your-project-name
  --filter "port 80"
Verify
The Akita Agent should now see all data coming to (and possibly from) the app or service running in the specified container.
In the Akita web console, check out the incoming data on the Model page. You should see a map of your API being generated as the Akita Agent gathers data.
Then check out the Metrics and Errors page to get real-time information on the health of your app or service.
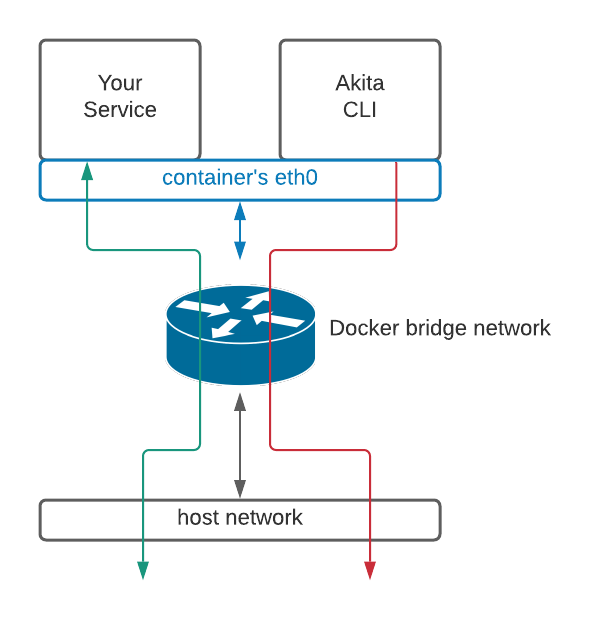
If everything has been set up successfully, your Akita deployment will look like this:

As shown in the diagram above, Akita will use the same network device as the service being monitored. It will not have visibility into other containers.
Updated about 3 years ago