[Alpha] API Monitors and Alerts
We're in alpha!
Akita's API monitors are an alpha feature. If you're in our beta, talk to us to try it out. If you're not in our beta, create your account here.
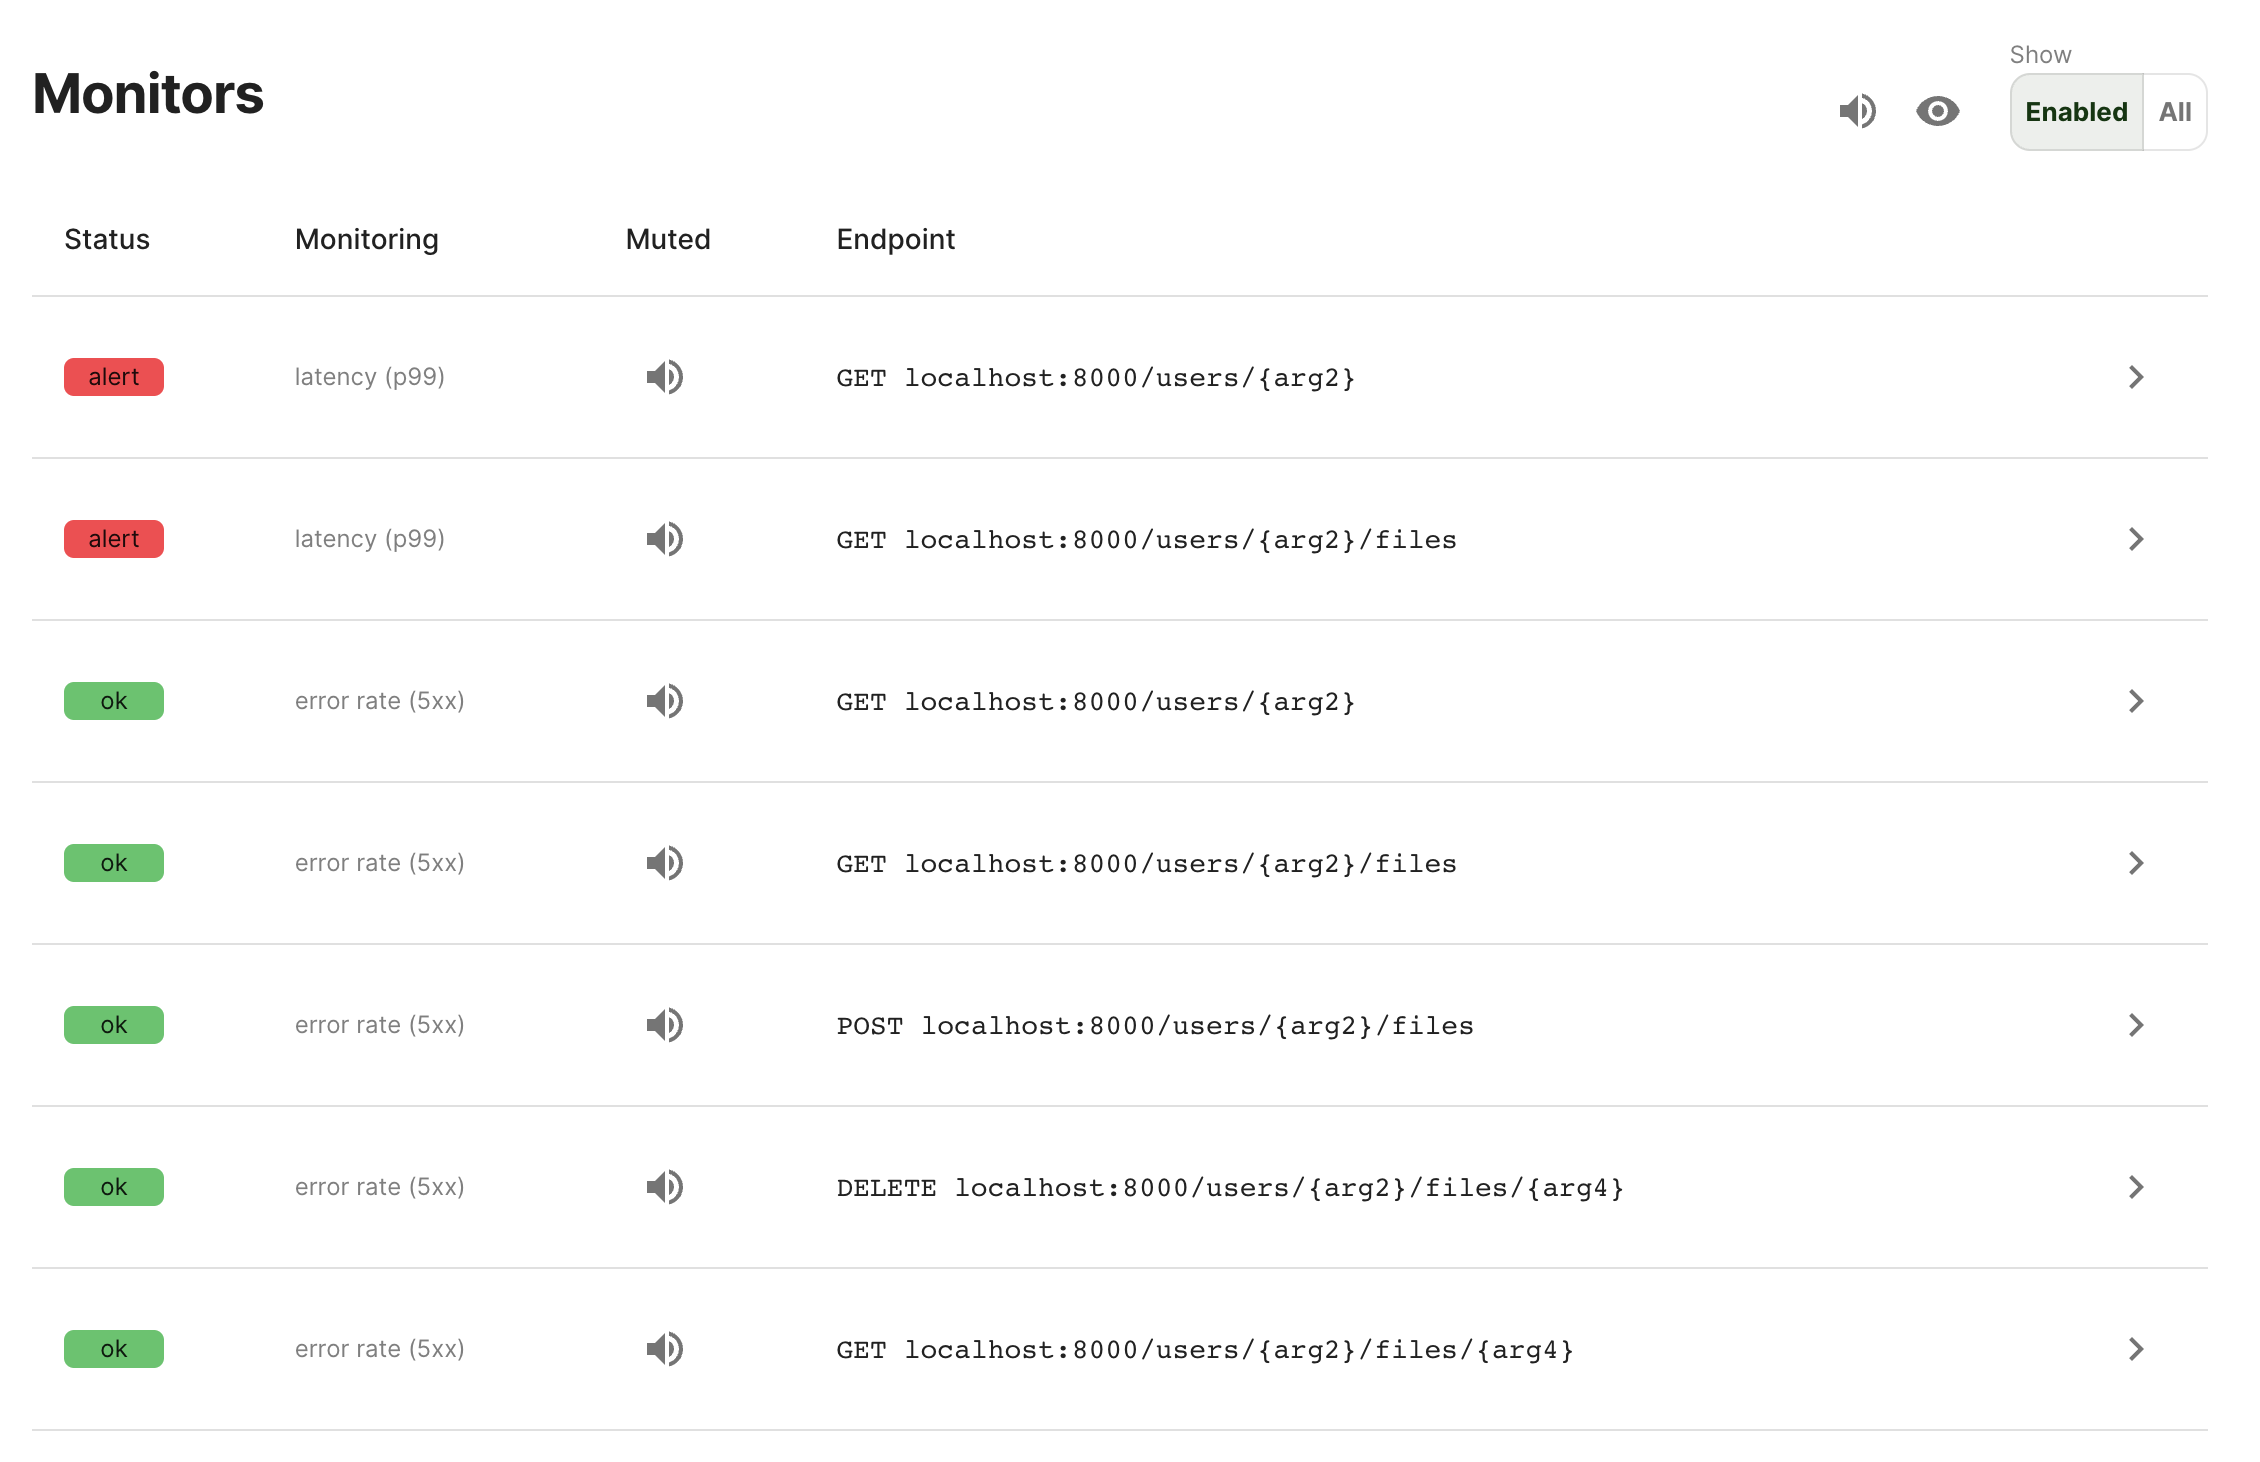
Akita makes it easy to track the health and performance of your endpoints with API monitors. API monitors measure the rate of error responses and the P99 latency of each endpoint, and notify you if a threshold is breached.

How are monitors created?
Akita automatically creates two API monitors with default alert thresholds for each API it observes, one monitoring 5XX error rate and another monitoring P99 latency.
-
5XX error rates are measured as the fraction of requests that return a response code between 500-599 out of all requests. These monitors have a default threshold of 0.001 — at least one 5XX response per one thousand requests.
-
P99 latency reports the 99th latency percentile of requests. These monitors are muted by default, because no one latency threshold fits every API.
Both measures are computed over a 5-minute sliding window. You can view all your API monitors on the API Monitors page.
Monitor history and adjusting alert thresholds
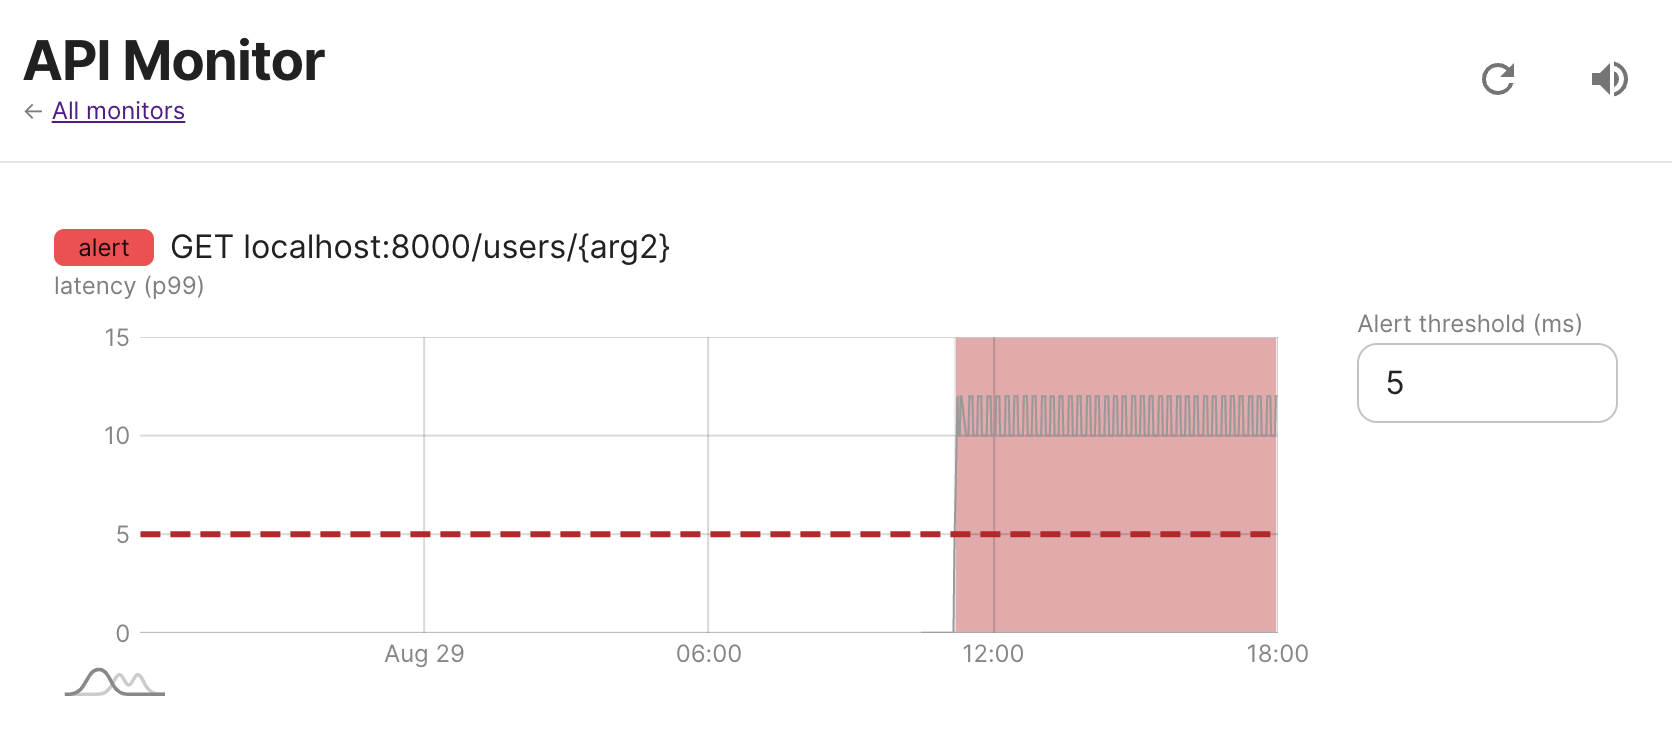
You can see a monitor's history and adjust its alert threshold. From the API Monitors page, find the monitor you would like to adjust and click the ">" button to the right of the endpoint name.

Edit the threshold by entering a new value in the input to the right of the time series.
Receiving email notifications
When a monitor threshold is breached, Akita sends you and your team members a notification email with links to any API monitors that have been triggered.
You can disable email notifications by muting or disabling API monitors.
Coming soon: Slack notifications
We're currently working on Slack notifications. Please talk to us if you'd like to be a design partner.
Muting notifications
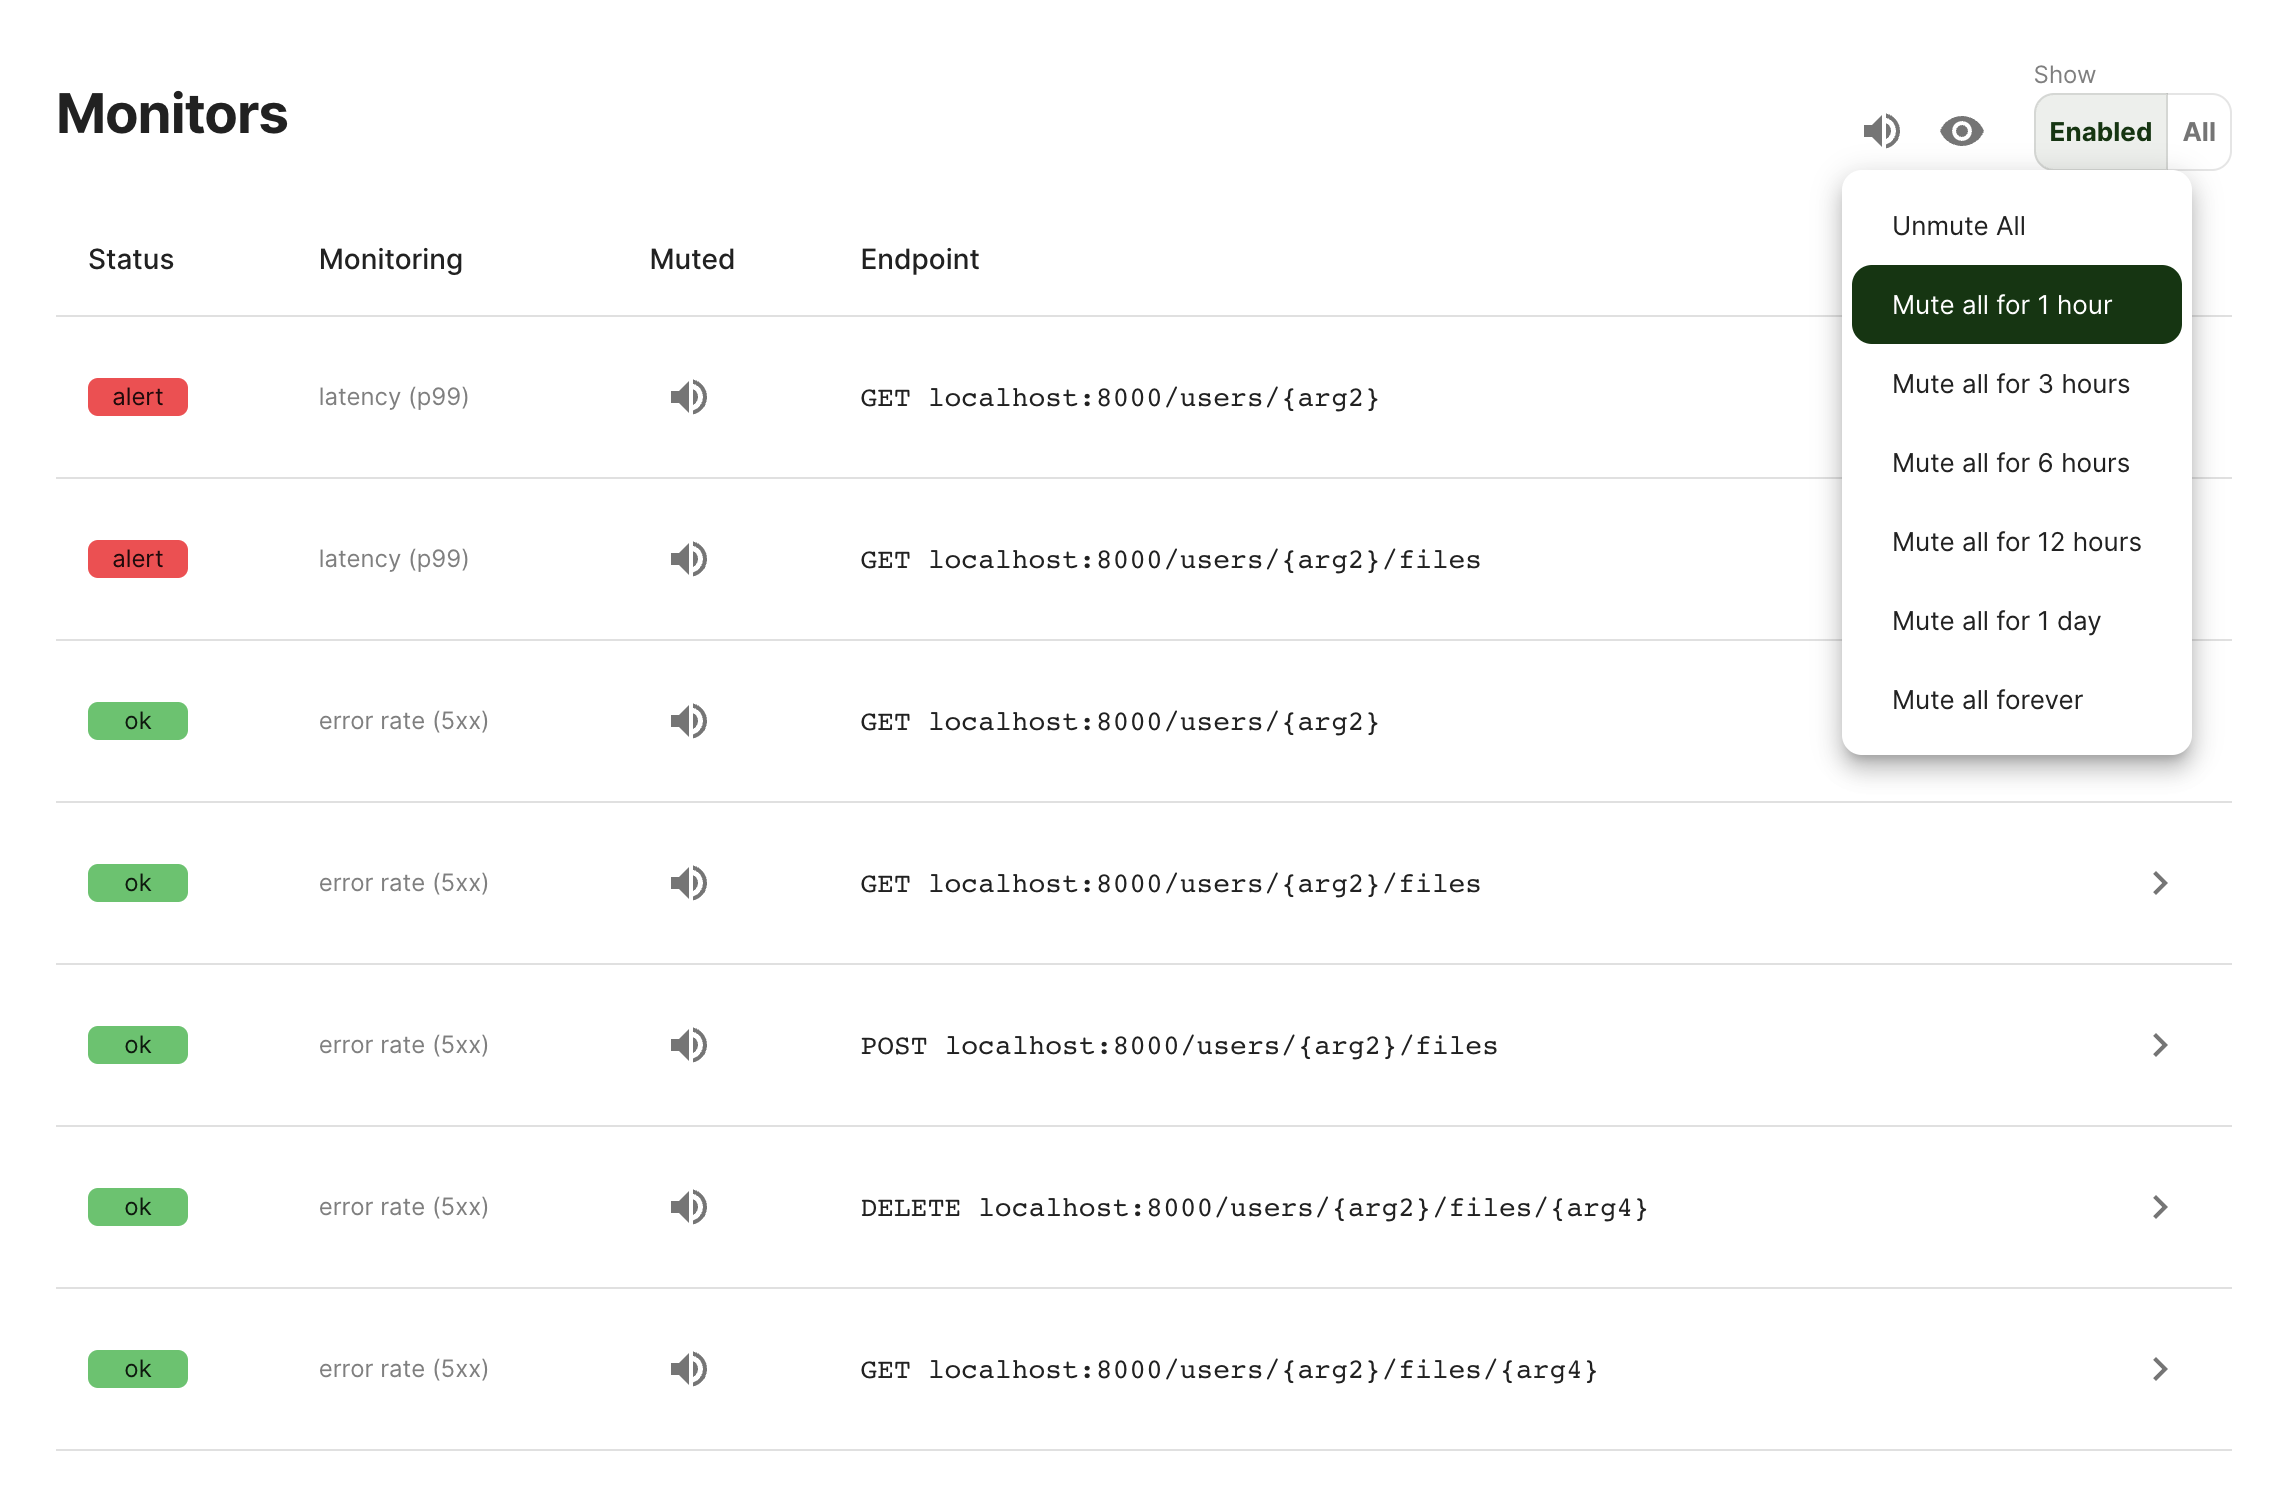
You can temporarily or permanently mute API monitors to stop receiving alert notifications. Each API monitor can be muted individually, or you can mute all your API monitors at once.

Hiding monitors
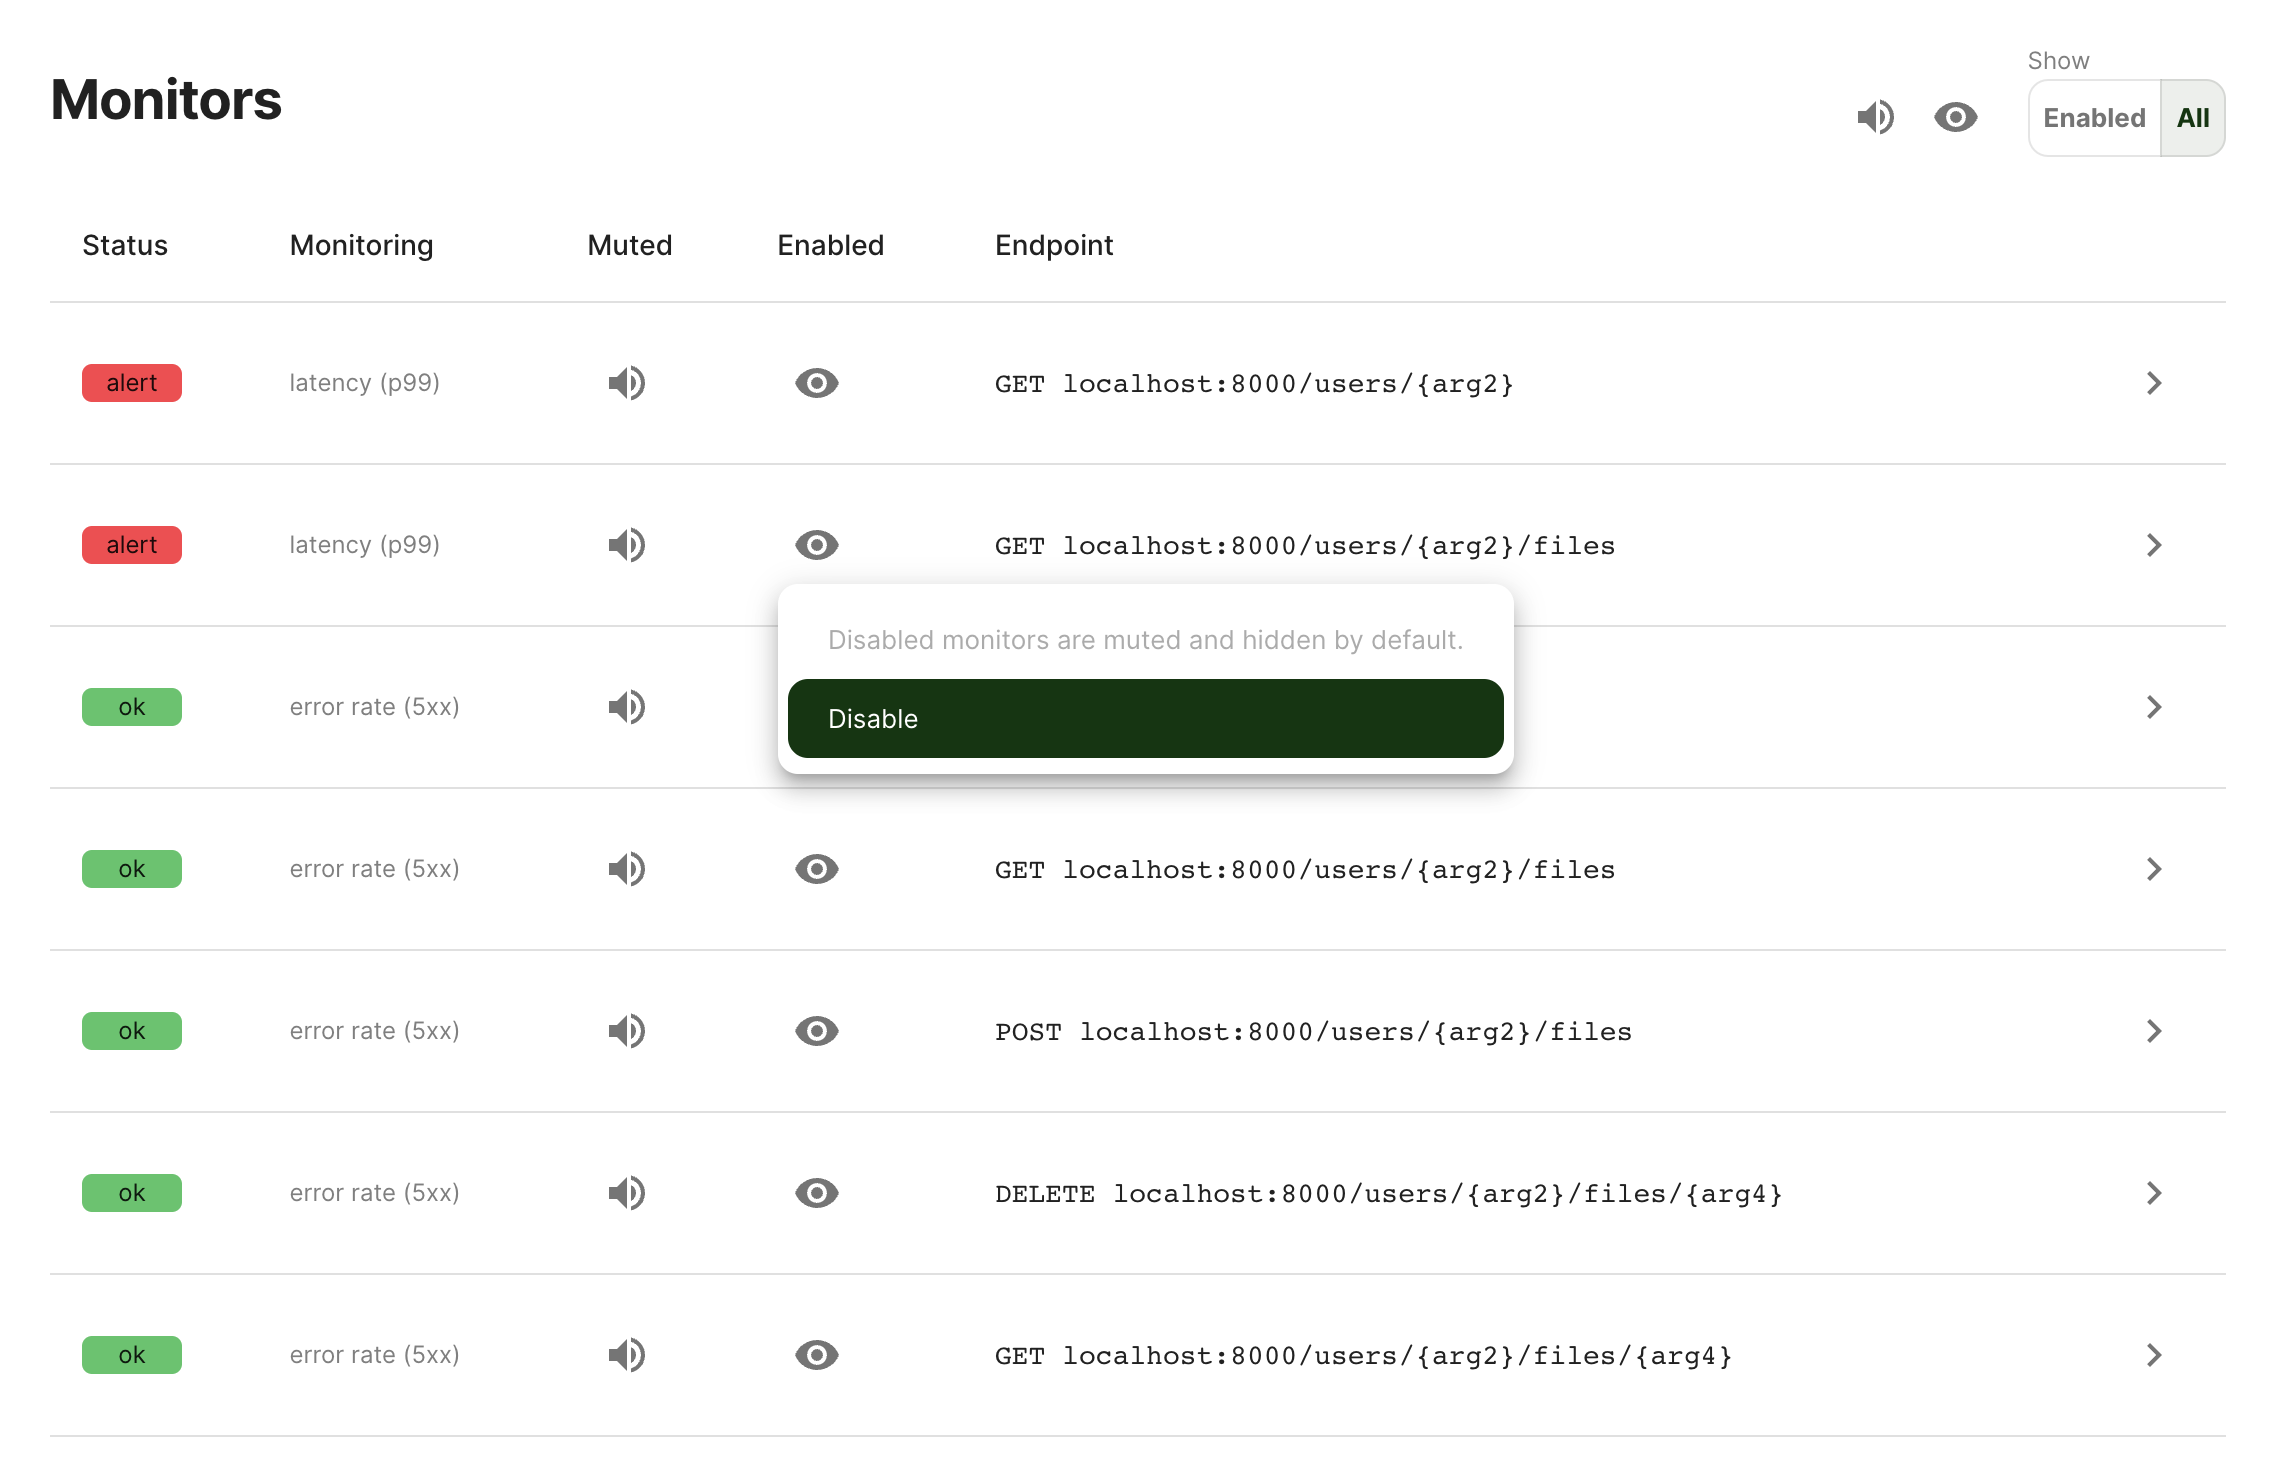
In some cases, you may want hide to hide API monitors you don't care about. Hidden monitors are muted and aren't shown on the API Monitors page by default.

You can show hidden monitors by selecting "Show All" at the top-right of the monitors table. Once you've selected "Show All", you can hide monitors by clicking the eye icon to disable them.
Updated almost 3 years ago