Explore Your API Graph
🚧 This feature is under construction. Thanks for your patience! 🚧
Deprecated feature
We have deprecated the service graph until further notice, due to focusing on our other monitoring features. Please get in touch if this is something you're interested in.
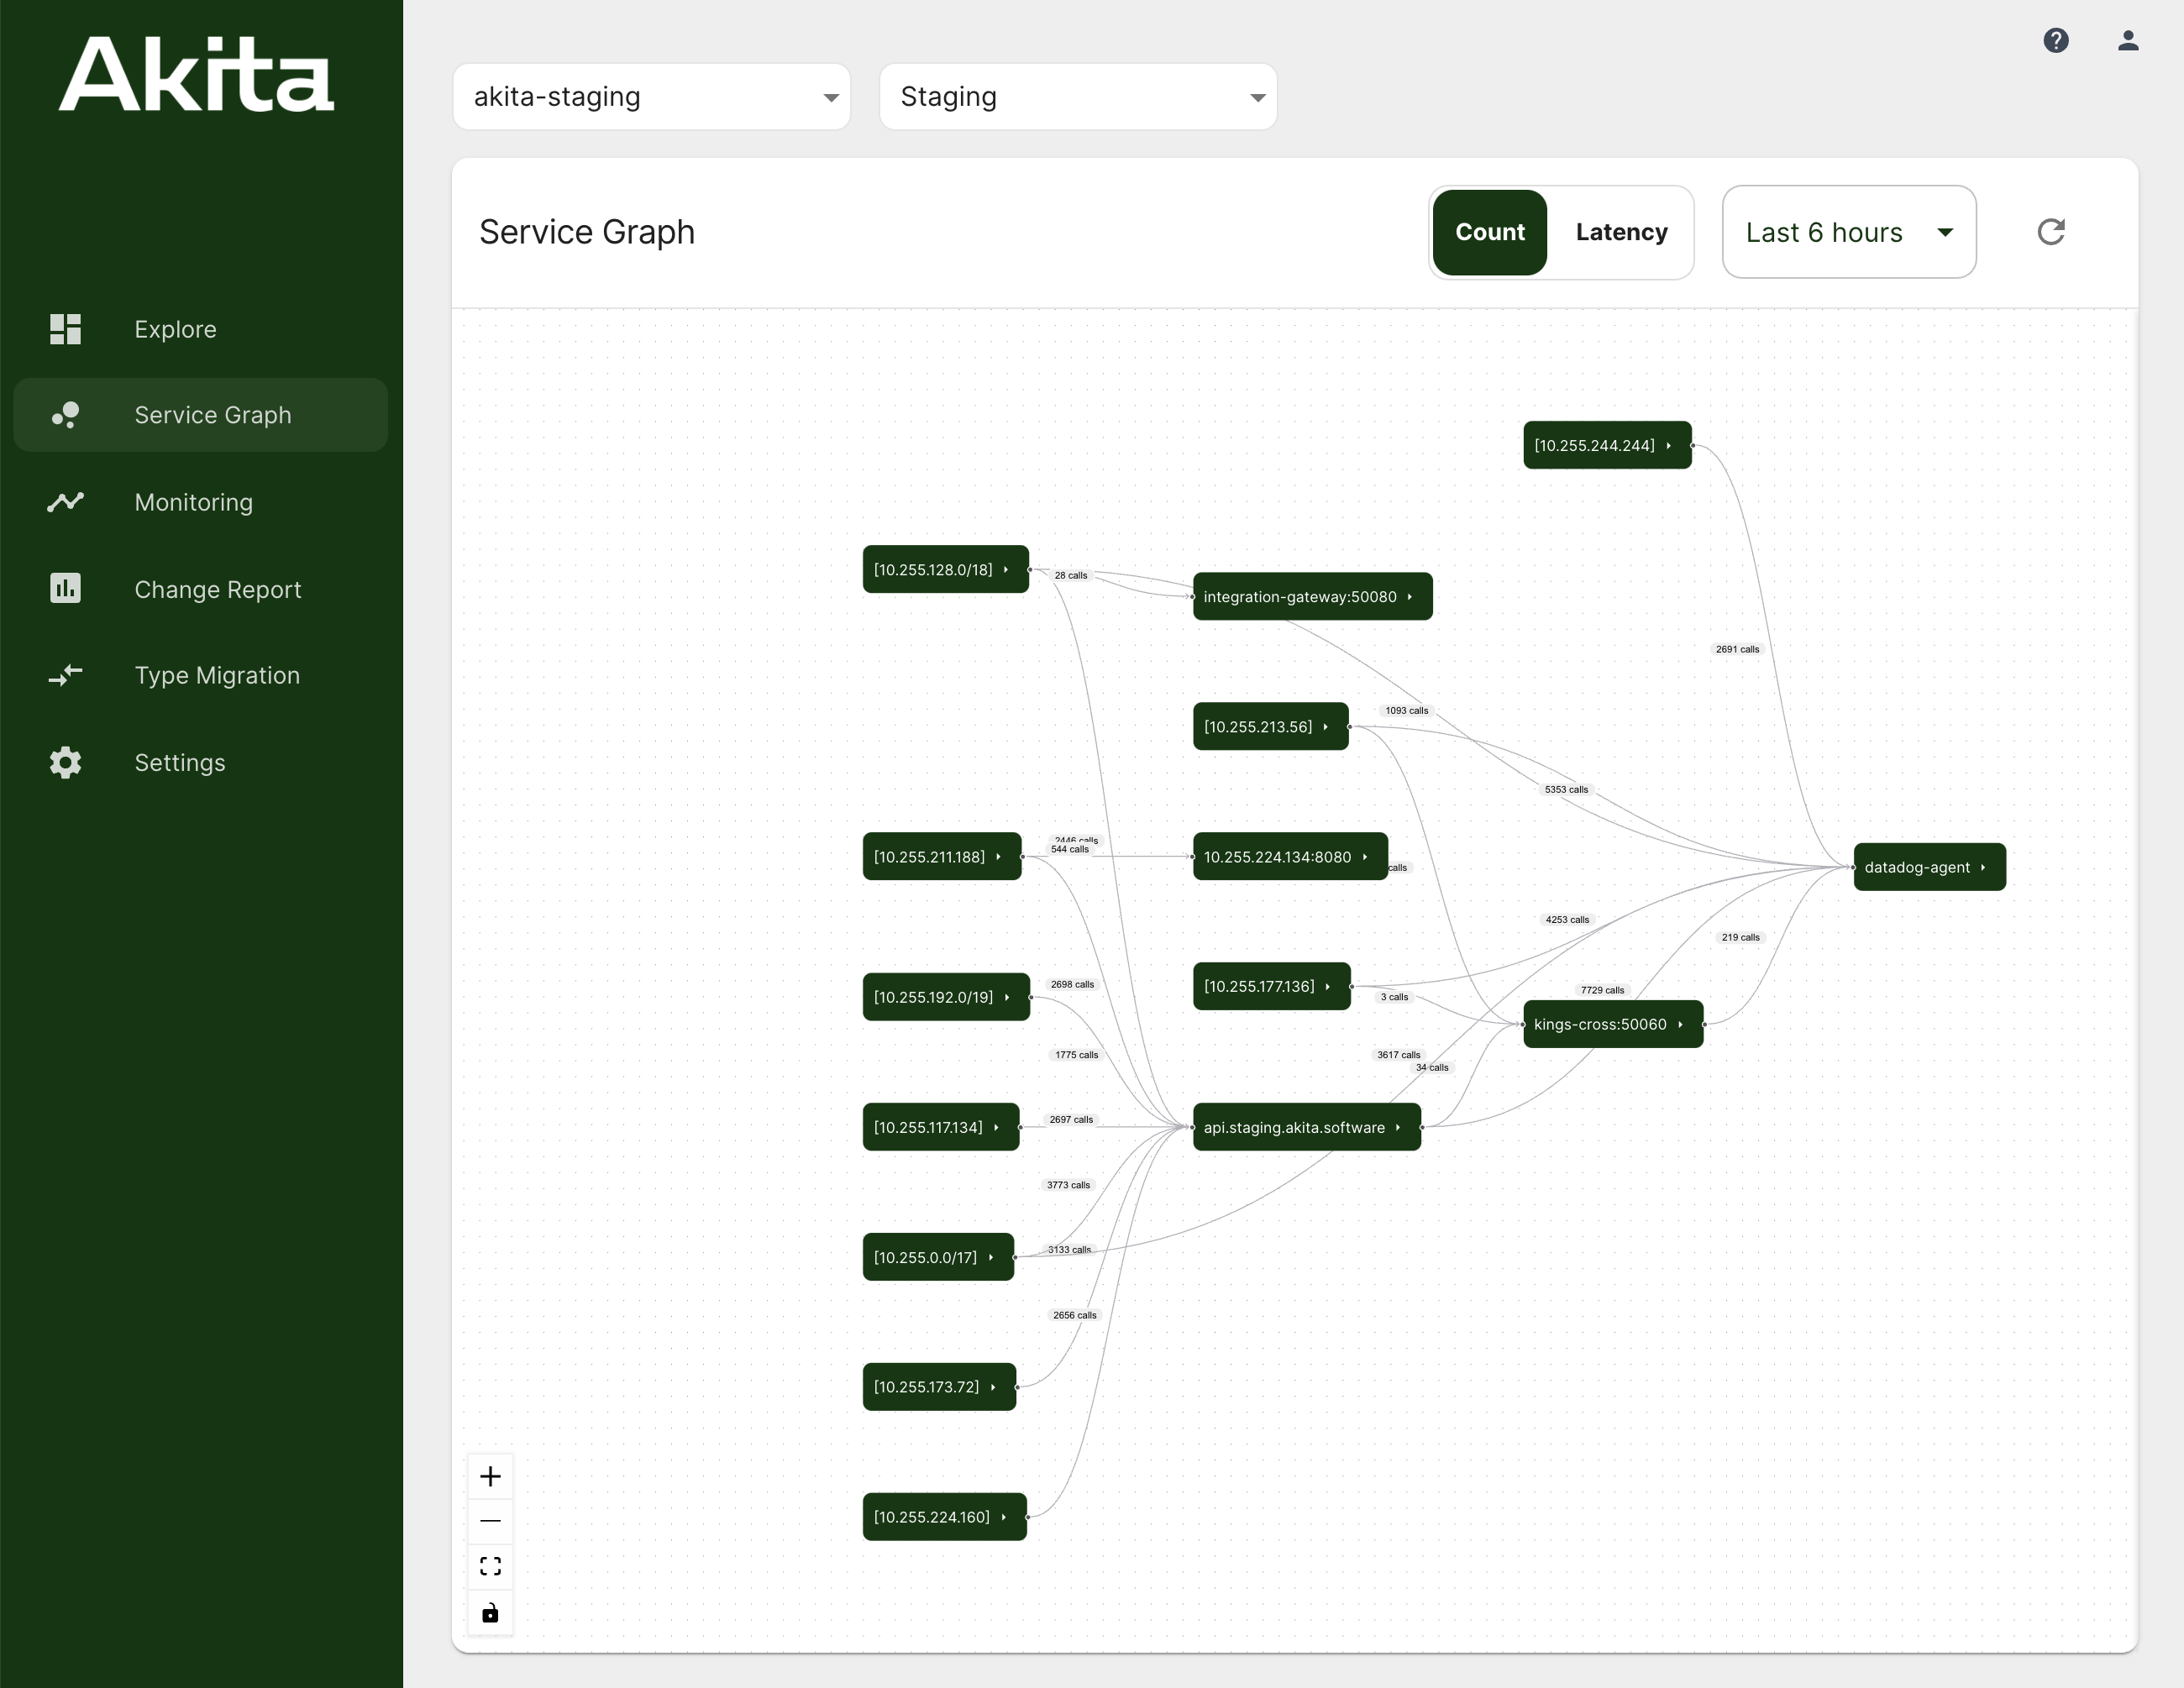
If you're running Akita in a staging or production environment, we will show you a graph of how your services are communicating. Any trace collected with the AKITA_DEPLOYMENT environment variable set (or the x-akita-deployment tag) will be incorporated into a timeline and service graph for that deployment.
The service graph has been tested in our Kubernetes environment, but should work in any multi-service environment in which we can see traffic both to and from your services.

You can find this visualization in the Akita Console under the "Service Graph" tab when viewing a service. Clicking on each service will show its full name in a sidebar.
Right now, you can see what services are calling each other, for all HTTP API calls from a service that also has an inbound HTTP API. In the future, you will be able to dig in to each edge of the service graph, and see additional information, like:
- which endpoints are being called by each client service
- how many calls have been made
We are also working to expand the scope of what the service graph covers, for instance across encrypted connections.
For now, you can retrieve some additional information using the get graph CLI command.
Getting a service graph for non-production environments
You can experiment with the service graph even when running locally. Be sure to assign a name to the AKITA_DEPLOYMENT environment variable when running akita learn or akita apidump. Automatically created models for continuous monitoring all come with a timeline and service graph.
Currently, we automatically assign a unique deployment name to continuous integration run, but these graphs are not yet available on the Akita Console.
Service names
Akita infers a service name by observing inbound HTTP traffic to an IP address. It then applies that name to outbound requests from the same IP address. The service graph uses the host portion of the HTTP URI as the service name.
Note that a Kubernetes cluster currently shows up as a single service/cluster right now. We will add more fine-grained support soon.
Troubleshooting the service graph
This matches the behavior of Kubernetes environments, where each pod is assigned an individual IP address. Given enough time, Akita can learn which pod IP addresses correspond to which service names. However, this inference might fail if:
- Network traffic is encrypted with TLS all the way to the service implementation.
- The Akita CLI has been configured to ignore inbound traffic to a service, using a host or path filter.
- Akita is not running on the nodes that can see inbound traffic to a service, and thus learn its name.
- The source service address has been rewritten by Network Address Translation.
- Multiple services are running in the same pod, or on the same EC2 host without any sort of isolation.
- Services are configured with each others' IP addresses instead of using names to refer to each other.
Akita's service inference should also work in Docker environments when configured to use host networking; this allows the Akita CLI to see both inbound and outbound traffic to a container.
Please contact us for help troubleshooting the service graph in a Docker environment, if interested.
The easiest way to get visibility into all your services is to run as a Kubernetes daemonset.
Akita will be able to distinguish traffic to a pod vs. traffic to a Kubernetes NodePort if it can learn or infer the node addresses. The recommended way to configure Akita in Kubernetes is to set additional environment variables, as described in Capturing Packet Traces in Kubernetes, which will give us the necessary information in the AKITA_K8S_NODE_IP environment variable.
Getting more information into the service graph
In the future, you will be able to configure the service graph creation to provide additional context, such as distinguishing external vs. internal addresses.
While we continue work on improving our inference, there are a few steps you can take to improve the quality of the service graph results.
- Ensure Akita is running in host mode so that it can see traffic to and from all the services on each node. Akita cannot infer anything from traffic is doesn't see!
- Use descriptive DNS names for the services you connect to, instead of raw IP addresses.
- Run Akita continuously for a long enough sample to see uncommon traffic. Akita rate limits its traffic collection, so the graph may be incomplete.
- Run Akita in debug mode and tell us about any parser errors or unknown content-types! Akita currently only shows the graph for HTTP requests and responses it has successfully parsed.
Updated over 3 years ago